

Managing insurance denials is critical for maintaining steady revenue and minimizing financial losses in healthcare practices. Denied claims not only delay payments but also increase administrative costs and strain team productivity. Tracking the right metrics can help identify problem areas and improve processes to reduce denials. Here are the five key metrics every practice should monitor:
- Overall Denial Rate: Measures the percentage of claims denied out of total submissions. Aim for less than 5%, as rates above 10% can signal deeper issues.
- Clean Claims Rate: Tracks the percentage of claims submitted correctly on the first attempt. Strive for 95%-98% to ensure faster payments and fewer rework costs.
- Denial Rate by Reason Code: Breaks down denials by specific causes (e.g., eligibility, coding errors). This helps pinpoint recurring issues and focus on targeted improvements.
- Denial Rate by Payer: Analyzes denials by insurance provider to identify payer-specific trends and challenges.
- Days in Accounts Receivable (AR) for Denied Claims: Monitors how long denied claims remain unpaid. Keep AR days below 35 to maintain healthy cash flow.
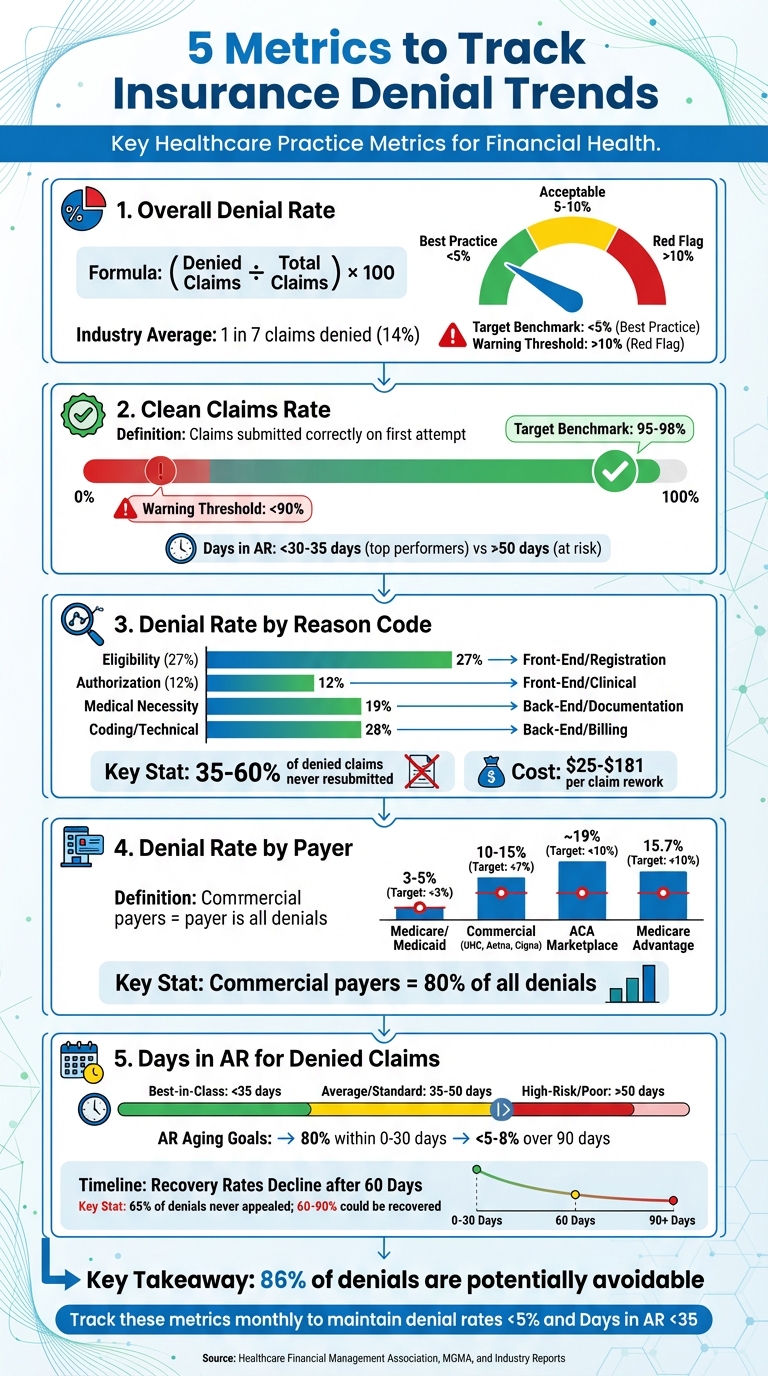
5 Key Metrics to Track Insurance Denial Trends in Healthcare
1. Overall Denial Rate
To calculate your overall denial rate, use this formula: (Denied Claims ÷ Total Claims) x 100. For instance, if you have 80 denied claims out of 1,000, your denial rate is 8%. Once you've determined this number, dig deeper into the data with advanced practice analytics to uncover any patterns in the denials.
Relevance for Identifying Denial Patterns
This metric helps you understand whether you're dealing with typical payer issues or facing a more serious revenue problem. Break your data down by payer and department - such as front-desk registration or coding - to identify where the trouble lies. For example, if one payer has a much higher denial rate than others, it could indicate a strained relationship that needs attention.
Impact on Revenue and Cash Flow
A denial rate above 10% is a red flag for financial health. Across the industry, about 1 in 7 claims are denied, adding up to more than 200 million rejections every year. The financial impact can escalate quickly. For example, if you’re denying 80 claims each month and the average rework cost is $70 per claim, that’s $5,600 in administrative expenses - before even considering delayed revenue. To maintain financial stability, aim for a denial rate below 5%.
Ease of Tracking and Benchmarking
This metric is easy to calculate monthly using your practice management system. Industry benchmarks provide helpful context: primary care practices tend to average between 6–9%, while specialties like dermatology, which are comparable to aesthetics, typically see rates of 4–6%. Comparing your performance against these benchmarks can reveal whether your rate - say, 8% - is acceptable or signals a deeper issue.
Actionability for Process Improvement
Monitor your denial rate weekly to catch problems before claims hit their timely filing deadlines. Instead of simply resubmitting denied claims, use this data to perform a root-cause analysis. For example, if your denial rate jumps from 6% to 10%, it could point to a new front-desk employee missing eligibility checks, recurring coding errors, or even a recent payer policy change.
In 2025, OhioHealth demonstrated how effective targeted interventions can be - they reduced claim denials by 42% by automating eligibility checks and streamlining digital intake workflows. This kind of proactive approach not only addresses current issues but also improves your overall processes. Using this metric as a starting point allows you to dig deeper into other denial-related data for even greater insights.
2. Clean Claims Rate
A clean claim is one that’s submitted correctly on the very first attempt. Often referred to as the first-pass resolution rate, this metric measures how well your front-end processes are functioning. A drop in your clean claims rate typically points to issues like errors in patient registration, incomplete insurance verification, or outdated coding practices. Addressing these early warning signs can help prevent denials before they snowball into bigger problems.
Relevance for Identifying Denial Patterns
Tracking your clean claims rate is a practical way to spot submission errors early, complementing broader denial analysis efforts. Essentially, it acts as a warning system, flagging potential problems before they result in costly denials. The industry standard for clean claims is around 98%, with top-performing practices maintaining rates above 95%. If your rate dips below 90%, it’s a sign of larger, systemic issues that demand immediate attention.
"Tracking clean claim percentage... is critical as the submission of clean claims helps reduce the denial rate and better ensures timely payment."
- Angela Mattioda, Vice President of Revenue Cycle Management Services at Surgical Notes
Breaking your clean claims data down by department can reveal where the bottlenecks are. For example, about 27% of denials stem from registration and eligibility errors, while another 12% are tied to authorization issues. If your front desk staff isn’t verifying insurance at least 48 hours before appointments, you’re likely setting the stage for incomplete claims that require manual corrections and follow-ups.
Impact on Revenue and Cash Flow
The financial implications of clean claims are hard to ignore. Boosting your clean claim rate by just 5% can increase net collections by tens of thousands of dollars annually. Reworking a denied claim costs between $25 and $118, depending on its complexity.
Clean claims also mean faster payments. Instead of waiting weeks - or even months - for reimbursement, these claims are typically paid within days. This keeps your Days in Accounts Receivable (AR) within the ideal range of 30–34 days. For aesthetic and wellness practices, where predictable cash flow is critical for covering payroll, purchasing supplies, and funding growth, maintaining a high clean claims rate is essential.
Ease of Tracking and Benchmarking
Your practice management system should automatically calculate your clean claims rate each month. Use the following benchmarks to evaluate your performance:
| Performance Level | Clean Claim Rate | Days in AR |
|---|---|---|
| Top Performers | 95%–98% | <30–35 days |
| Average/At Risk | <90% | >50 days |
Keeping up with this metric is becoming increasingly challenging. In 2025, 70% of healthcare providers reported that submitting clean claims had become more difficult compared to the previous year. Payers now use advanced AI tools like UnitedHealth’s nH Predict and Cigna’s PXDx to spot even minor errors with remarkable accuracy, leading to more frequent denials.
Actionability for Process Improvement
To improve your clean claims rate, start by implementing automated claim scrubbing tools that check for errors line-by-line before submission. Insurance eligibility should be verified at least 48 hours before every patient visit - this simple step can prevent many of the most common errors.
Assign dedicated staff to handle prior authorizations and focus on coding accuracy. Conduct monthly audits by payer and CPT code to identify recurring issues. With these targeted actions, your clean claims rate can shift from being just a metric to a powerful tool for recovering revenue and improving overall efficiency.
3. Denial Rate by Reason Code
Relevance for Identifying Denial Patterns
Understanding why claims are denied is just as important as knowing how often it happens. That's where reason codes come into play - they explain the specific issues behind each denial, such as coding mistakes, duplicate submissions, or missing documentation for medical necessity. By categorizing these denials, you can separate one-off errors from bigger, recurring problems that need immediate fixes.
Mapping these codes to specific departments can also help you pinpoint where the breakdown is happening. For example, a surge in eligibility denials might signal a problem at the front desk. On the other hand, a rise in medical necessity denials could mean your clinical documentation or coding team needs extra support. In fact, in 2025, 50% of revenue cycle leaders identified missing or incorrect claim data as the leading cause of higher denial rates, with 35% citing prior authorization challenges. Tracking these trends gives you a roadmap to focus your efforts where they’ll make the biggest difference.
Impact on Revenue and Cash Flow
Denial rates broken down by reason code don’t just delay payments - they can significantly hurt your bottom line. Studies show that 35% to 60% of denied claims are never resubmitted, meaning that revenue is permanently lost. And when claims are reworked, the cost can range from $25 to $181 per claim. After 60 days, the chances of recovering that money drop even further. For practices with tight profit margins, this kind of revenue loss can mean the difference between staying in the green or falling behind. Consider this: in 2025, OhioHealth tackled claim errors early by using Experian Health's Patient Access Curator, cutting denial rates by 42% through better data accuracy at patient intake.
Ease of Tracking and Benchmarking
Your practice management system should make it easy to track and categorize denials by reason code. Using standard categories like Eligibility, Authorization, Medical Necessity, and Coding/Technical simplifies the process and helps you compare your performance against industry benchmarks. This shared framework lets you quickly identify which areas are causing the most issues.
| Denial Reason Category | Common Sub-Issues | Impact Area |
|---|---|---|
| Eligibility | Coordination of benefits, expired coverage | Front-End / Registration |
| Authorization | Missing prior-auth, referral not on file | Front-End / Clinical |
| Medical Necessity | Insufficient clinicals, level of care disputes | Back-End / Documentation |
| Coding/Technical | Invalid CPT/ICD-10 codes, missing modifiers | Back-End / Billing |
This kind of categorization not only makes tracking easier but also lays the groundwork for targeted improvements.
Actionability for Process Improvement
Addressing denials effectively requires targeted actions. For example, if 26% of your denials stem from incomplete or inaccurate patient data, focus on tightening insurance verification processes at the front desk. If authorization errors are a recurring issue, centralizing and automating those workflows could help reduce manual mistakes.
Regular audits of reason codes and payer trends - ideally monthly - can help you spot new patterns early. Use this data to guide specific training initiatives. For instance, if modifier errors are a common problem, update your coding team on the latest CPT guidelines. Reviewing accounts receivable weekly, especially those older than 60 days, can help you avoid missing filing deadlines. The ultimate goal is to shift from simply fixing denials to preventing them altogether.
"Perhaps the most impactful way to address claim denials is through a strong and detailed denials management process or strategy... It seeks the root cause for the denial as well as the coded cause."
4. Denial Rate by Payer
Relevance for Identifying Denial Patterns
Tracking denial rates by payer offers a closer look at challenges specific to different insurers, helping healthcare providers create targeted strategies. Each payer has its own set of denial criteria, often influenced by automated review systems like UnitedHealth's nH Predict and Cigna's PXDx. Commercial payers, including UnitedHealthcare, Aetna, and Cigna, tend to generate higher denial volumes due to these systems.
"Healthy" denial thresholds also vary widely by payer type. For example, Medicare typically has lower denial rates, ranging from 3% to 5%, while commercial payers often fall between 10% and 15%. In 2023, 19% of in-network claims submitted through HealthCare.gov insurers were denied. Monitoring denials by payer and CPT cluster on a monthly basis is essential to catching shifts early, like updates to medical necessity algorithms or prior authorization rules.
Impact on Revenue and Cash Flow
Payer-specific denial trends can do more than delay payments - they can disrupt your financial stability. Commercial payers account for about 80% of all claim denials, and these denials can cost healthcare systems up to 2% of their net patient revenue. For smaller practices, denial rates exceeding 10% can threaten staffing and long-term operations.
The financial toll adds up quickly. Reworking a single denied claim costs healthcare providers between $25 and $181. On top of that, managing claim denials consumes approximately 20% of total revenue cycle expenses. Medicare Advantage plans, for instance, experienced a 4.8% increase in denials from 2023 to 2024. In the ACA marketplace, denial rates vary dramatically, from as low as 2% to as high as 49%.
Ease of Tracking and Benchmarking
A solid practice management system should make it easy to break down denial data by payer. This allows providers to benchmark performance and pinpoint which insurers are creating the most obstacles. The table below highlights how denial rates differ across payer types:
| Payer Type | Average Denial Rate (2025/2026) | Target Benchmark |
|---|---|---|
| Medicare / Medicaid | 3–5% | < 3% |
| Commercial (UHC, Aetna, Cigna) | 10–15% | < 7% |
| ACA Marketplace | ~19% | < 10% |
| Medicare Advantage | 15.7% | < 10% |
"Claim denial rates vary significantly by payer type - whether they be public or private, or what insurance company owns them and where they are located."
- Jacqueline LaPointe, Executive Editor, TechTarget
These comparisons provide a foundation for improving denial management processes.
Actionability for Process Improvement
Using payer-specific data, healthcare providers can take focused actions to address denial issues. Start by prioritizing high-denial payers and using a timely filing matrix, as deadlines range from 90 days to one year. Monthly CPT/payer audits can help identify new medical necessity triggers. Assigning dedicated staff to manage prior authorizations can significantly reduce rework costs and recover lost revenue. For Medicare Advantage plans, 57% of initial denials are overturned on appeal, proving that targeted efforts can yield substantial returns.
sbb-itb-02f5876
5. Days in Accounts Receivable for Denied Claims
Relevance for Identifying Denial Patterns
Days in Accounts Receivable (AR) for denied claims is a critical metric for understanding cash flow performance. It highlights how long revenue gets stuck in payer queues or appeals processes before it can be reinvested. Breaking AR down by payer is where its real value lies. For instance, a practice might have an overall AR of 45 days, but Medicaid claims could average 75 days - pointing to a specific issue that needs attention.
Recovery rates drop steeply after 60 days, and by 90 days, many claims are written off entirely. This metric doesn’t just identify stalled revenue; it also uncovers payer-specific delays, helping practices focus on where improvements are needed most.
"How many days a claim sits in A/R is perhaps the single most important revenue cycle metric; it tells a practice the number of days money owed remains unpaid."
- Jim Denny, MBA, Founder and CEO, Navicure
Impact on Revenue and Cash Flow
Unresolved claims have a major effect on revenue and cash flow. Reworking a denied claim costs anywhere from $25 to $181, and delays past 60 days significantly increase the risk of losing that revenue altogether.
Top-performing practices keep Days in AR below 35 days, while anything over 50 days signals deeper systemic issues. For optimal AR aging, at least 80% of AR should fall within 0–30 days, with less than 5–8% exceeding 90 days. However, recent trends show AR timelines growing longer due to stricter medical necessity algorithms and AI-based reviews from insurers like UnitedHealthcare and Cigna.
| Performance Category | Days in AR Benchmark |
|---|---|
| Best-in-Class | < 35 days |
| Average/Standard | 35–50 days |
| High-Risk/Poor | > 50 days |
Actionability for Process Improvement
To keep AR under control, practices should review claims that hit the 60+ day mark weekly to avoid missing filing deadlines. Break down AR days by payer to spot specific bottlenecks. Additionally, separate patient payment plans from insurance AR to get an accurate picture of performance.
Set clear goals to resolve or appeal denied claims within 20 to 30 days of receipt to speed up cash flow. When calculating AR, exclude credits (funds owed to the practice) for a more accurate view. It’s worth noting that about 65% of denials are never appealed, even though 60% to 90% of them could be recovered with proper follow-up. By managing AR days effectively, practices can also boost their overall clean claims and denial rates.
How Prospyr's Practice Analytics Can Help
Prospyr's real-time analytics dashboard gives you a complete view of the five key denial metrics, allowing you to monitor your Initial Denial Rate and Days in AR as they happen. Instead of relying on monthly reports, you can catch potential issues early, preventing them from turning into cash flow problems. Plus, its integrated CRM/EMR system flags front-end errors during registration, addressing the nearly 50% of denials caused by pre-service mistakes.
Beyond real-time tracking, Prospyr dives deeper with diagnostic analytics. It performs root-cause analyses on denials, uncovering patterns like recurring coding errors, missing patient details, or mismatched CPT/ICD-10 codes. This helps pinpoint why claims are denied, not just that they are. You can also break down denial trends by payer and reason code, identifying if certain insurers are rejecting claims more frequently than the 5–10% industry standard.
The platform's automated reporting prioritizes high-value denials, ensuring your team focuses on the claims that matter most. Considering the average cost to rework a denied claim is about $25, and nearly 90% of denials are preventable with the right tools, this efficiency directly impacts your financial performance. Prospyr also categorizes denials into "soft denials" (fixable issues) and "hard denials" (irrecoverable claims), so your team avoids wasting time on claims that can't be recovered.
To tackle the leading cause of denials - registration and eligibility issues, responsible for nearly 27% of rejected claims - Prospyr automates eligibility verification, running checks at least 48 hours before services are scheduled. Its real-time claim scrubbing also catches errors before submission, preventing "dirty" claims from reaching payers. These proactive measures help top-performing practices keep their Days in AR under 35 and denial rates below 5%.
The shared dashboard brings your entire team - finance, clinical, and coding staff - together around the same metrics, promoting accountability and collaboration. Weekly AR reviews become easier when you can quickly spot claims nearing the 60-day mark, where recovery rates drop significantly and filing deadlines approach. With about 65% of denials going unappealed due to time or resource constraints, Prospyr's automated workflows ensure recoverable revenue doesn’t slip away.
Conclusion
Tracking key metrics like Overall Denial Rate, Clean Claims Rate, Denial Rate by Reason Code, Denial Rate by Payer, and Days in Accounts Receivable is critical for aesthetic and wellness practices aiming to protect their revenue streams. With around 86% of denials deemed potentially avoidable and over half of denied claims left unaddressed due to resource limitations, the financial stakes are high. Unresolved denials can lead to permanent revenue loss, making early intervention essential.
These metrics do more than pinpoint problem areas - they provide actionable insights to improve processes and staff training. By addressing both front-end and back-end errors, practices can optimize workflows in areas like registration and coding. High-performing practices leverage this data to keep denial rates under 5% and Days in AR below 35 days, ensuring steady cash flow that can be reinvested into critical areas like staffing, technology, and patient care.
However, manual tracking often falls short, especially as payers utilize advanced AI tools like UnitedHealth's nH Predict and Cigna's PXDx. Centralized analytics offer a more efficient solution. Tools like Prospyr's real-time analytics dashboard simplify the process with automated eligibility checks and root-cause analysis. This helps practices catch issues early, preventing recoverable revenue from slipping away as claims age beyond 60 days.
"In 2025, benchmark literacy is a survival skill. Without objective performance targets, practices cannot distinguish between standard payer friction and serious revenue leakage."
FAQs
How does monitoring the overall denial rate benefit a practice's financial performance?
Keeping an eye on the overall denial rate helps medical practices identify recurring problems in claims processing. Tackling these issues can minimize preventable denials, reduce revenue losses, and improve cash flow, creating a stronger financial foundation. Spotting trends in denial rates also provides an opportunity to fine-tune processes and boost operational efficiency, paving the way for steady growth and stability over time.
How can I improve my clean claims rate and reduce insurance denials?
Improving your clean claims rate and cutting down on insurance denials comes down to accuracy, proactive monitoring, and streamlined processes. First, make sure every piece of claim data is complete and correct - even small errors or missing details can lead to denials. Using automation and AI tools can catch and fix these issues early in the process, saving time and effort.
Keep a close eye on key metrics like denial rates, clean claim percentages, and recurring denial trends. For example, look for patterns like coding mistakes or incomplete documentation. Identifying these problems allows you to address them before they become ongoing issues. Also, focus on thorough patient registration and secure prior authorizations when needed to avoid common errors.
Regular staff training and leveraging real-time analytics for immediate feedback can further refine your workflow. By putting these strategies into action, healthcare providers can submit cleaner claims, reduce denials, and improve reimbursement results.
Why is it important to track denial rates by payer, and how does it impact revenue?
Tracking denial rates by payer is a crucial step in understanding patterns or recurring challenges in claims processing. High denial rates often indicate issues such as incorrect coding, missing documentation, or unmet payer-specific requirements. Tackling these problems head-on can cut down on rework and delays, paving the way for quicker reimbursements and healthier cash flow.
If denial rates go unchecked, the financial impact can be significant. Denied claims demand extra time and resources to appeal and resolve, draining revenue. By keeping a close eye on these trends, practices can identify bottlenecks, refine their claims management processes, and boost overall financial performance.

