
To grow your med spa's revenue, you need to track the right metrics. These metrics reveal hidden problems, improve operational efficiency, and help you make smarter decisions. Here's a quick breakdown:
- Patient Retention Rate: Aim for a 90-day return rate of 60%+ to build loyalty and reduce marketing costs.
- Average Revenue Per Client: Shows how much each client spends and highlights upselling opportunities.
- Average Revenue Per Visit: Focuses on maximizing the value of each appointment, with a target of $450–$600 per visit.
- Patient Lifetime Value (LTV): Measures total revenue per client over time. Pair it with a strong LTV:CAC ratio (4:1 or higher).
- Appointment Utilization: Fill provider schedules effectively to minimize revenue loss from empty slots.
- No-Show and Cancellation Rate: Keep no-shows under 5% and cancellations below 10% to protect earnings.
- Client Acquisition Cost (CAC): Monitor how much it costs to bring in new clients and ensure your LTV:CAC ratio is profitable.
- Retail-to-Service Ratio: Boost revenue by selling products alongside treatments.
- Membership Performance: Track churn, breakage, and revenue margins to create steady income streams.
- Revenue Per Provider: Measure how much each team member contributes to overall revenue.
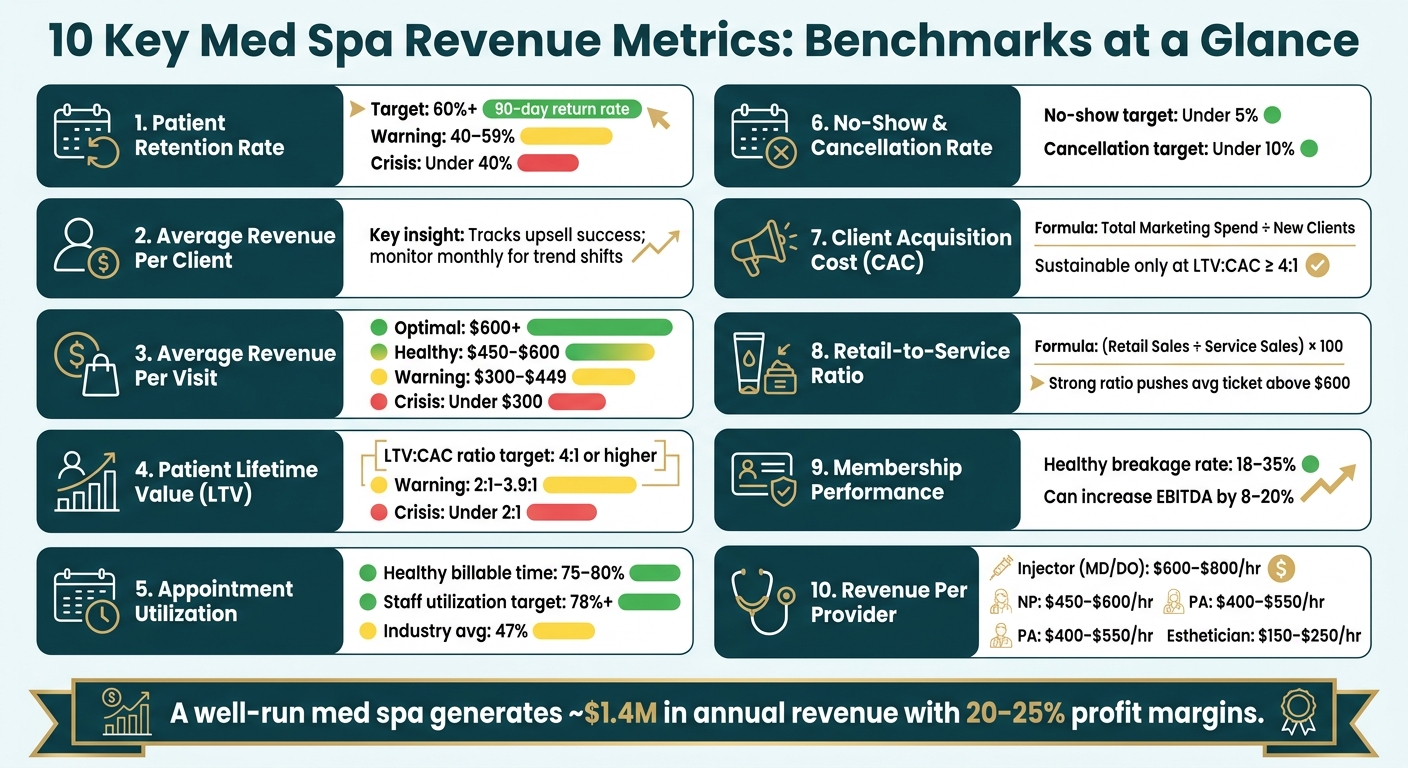
10 Key Med Spa Revenue Metrics: Benchmarks at a Glance
1. Patient Retention Rate
Patient retention rate reflects the percentage of clients who return within a specific period - a clear indicator of whether your med spa is delivering ongoing value or just attracting one-time visits.
"Retaining existing clients is far more cost-effective than constantly acquiring new ones, and it helps keep your calendar consistently full." - Pabau
The 90-day window is critical. If a client doesn’t rebook within 90 days, the data shows they’re unlikely to return. Top-performing med spas aim for an overall retention rate above 75%, with a 90-day return rate of at least 60%. If your 90-day return rate falls below 40%, it’s a red flag. This could point to issues like poor follow-up, unmet expectations, or a lack of perceived value.
Breaking this metric down by treatment type provides even deeper insights. For example, injectable treatments often see rebooking rates between 70–90%, while facial services typically fall in the 60–80% range. Tracking these separately can highlight which services are most effective for building client loyalty.
Cost-wise, retaining a client is much cheaper than acquiring a new one - anywhere from 5 to 25 times less expensive. Every missed rebooking represents not only a loss in future revenue but also wasted marketing dollars. As Ward Advisory explains, "Retention is not just a revenue stabilizer, it is a margin multiplier."
Tools like Prospyr can help automate follow-up efforts, ensuring clients don’t slip through the cracks after the 90-day mark. With features like practice analytics and automated SMS/email reminders, these systems make it easier to prompt timely rebookings and maintain strong retention rates. By focusing on retention, you’re not just stabilizing revenue - you’re creating a reliable foundation for growth.
| Metric | Healthy Benchmark | Warning Zone | Crisis Threshold |
|---|---|---|---|
| Rebooking Rate (Existing Clients) | 60%+ | 40–59% | Under 40% |
| Rebooking Rate (New Clients) | 40%+ | 30–39% | Under 30% |
| 90-Day Return Rate | 60%+ | 40–59% | Under 40% |
| New-to-Returning Patient Ratio | 20–35% new | 35–50% new | Over 60% new |
2. Average Revenue Per Client
Average revenue per client is calculated by dividing total revenue by the number of unique clients served within a specific timeframe. This metric provides a snapshot of how deeply clients are engaging with your services and identifies areas where spending could be increased.
"Finding your average revenue per client will help you focus on cultivating clients with the biggest impact on your bottom line, rather than simply trying to get more people through your doors." - Shanalie Wijesinghe, Content Strategy Director, Boulevard
A lower-than-expected average revenue per client often indicates untapped potential. For instance, if clients primarily stick to a single service, such as injectables, without exploring retail skincare products or complementary treatments, it suggests missed cross-selling opportunities. It could also point to a need for better staff training - team members might not be effectively introducing clients to your full range of offerings. Quick wins, such as implementing easy-to-sell add-ons, can help boost this number significantly.
Tracking this metric consistently allows you to gauge the effectiveness of operational changes. Whether you’ve updated your add-on menu or launched a gift card promotion, monitoring this metric lets you see immediate results - be it a short-term fluctuation or a lasting improvement. Evaluating data month over month is particularly useful, as it enables you to spot trends early, avoiding the pitfalls of waiting for quarterly reviews when revenue losses may already have occurred. This metric works hand in hand with other KPIs, helping you refine your service mix, improve staff performance, and optimize promotions.
While spreadsheets can be used to track this data, they can be time-consuming and prone to errors. Tools like Prospyr simplify the process by providing real-time analytics dashboards. These platforms allow you to make quicker, well-informed decisions about service offerings, staff training, and promotional strategies.
Here’s a quick breakdown of key calculations tied to average revenue per client:
| Metric | Calculation | What It Tells You |
|---|---|---|
| Average Revenue Per Client | Total Revenue ÷ Total Unique Clients | Measures overall client spending and upsell success |
| Revenue Per Treatment | Total Revenue ÷ Number of Treatments | Highlights the profitability of specific services |
| Retail-to-Service Ratio | (Total Retail Sales ÷ Total Service Sales) × 100 | Reflects how effectively products are being sold alongside services |
3. Average Revenue Per Visit
Average revenue per visit tells you how much revenue each appointment brings in on average. You can calculate it by dividing your total revenue by the total number of visits over a specific time period. While the average revenue per client focuses on long-term spending habits, this metric zeroes in on the revenue generated from individual appointments. It’s a quick way to evaluate how well each appointment slot is performing.
"Average Ticket reveals how effectively you are maximizing each appointment slot. A practice with high patient volume but a low average ticket is working harder for less money." - Ward Advisory
For example, appointments focused solely on Botox tend to bring in less revenue, while a mix of services typically generates more per visit. In 2026, the target range for average revenue per visit is $450–$600, with anything below $300 indicating a problem that needs immediate attention.
| Performance Level | Average Revenue Per Visit | What It Signals |
|---|---|---|
| Optimal | $600+ | Strong retail integration and membership revenue |
| Healthy | $450–$600 | Good service mix and upselling practices |
| Warning | $300–$449 | Visits are happening, but appointment slots aren’t being maximized |
| Crisis | Under $300 | Issues with pricing or service mix that need urgent action |
A drop in this metric - even if appointment volume is steady - can signal deeper issues like pricing problems, too many discounts, or poor service allocation. To address this, train your team to suggest additional services or retail products that make sense for the client. Bundling treatments is another effective way to increase the value of each booking.
Monitoring this figure monthly is crucial. Sharp declines can uncover profit leaks, such as unauthorized discounts or schedules filled with low-margin services, before they create bigger financial problems. Tools like Prospyr offer real-time analytics, helping you spot and fix these issues early, rather than waiting for quarterly reports to reveal them.
4. Patient Lifetime Value (LTV)
When it comes to understanding your med spa's financial health, Patient Lifetime Value (LTV) is a game-changer. This metric represents the total revenue a single client is expected to generate throughout their relationship with your business. To calculate LTV, multiply three factors: average revenue per visit, the number of visits per year, and the client lifespan.
Why does LTV matter? It's all about shifting your perspective from short-term gains to the bigger picture. By focusing on the cumulative value each client brings, you can make smarter decisions about marketing budgets, service offerings, and strategies to keep clients coming back.
"The easiest way to sink a medspa is to overspend on marketing and underdeliver on retention. Your LTV:CAC ratio shows whether your marketing engine is building long-term value, or bleeding cash." - CorralData
One of the most telling metrics tied to LTV is the LTV to Client Acquisition Cost (CAC) ratio. This ratio reveals how effectively your marketing dollars are translating into long-term revenue. The goal? A 4:1 ratio or higher, meaning every dollar spent to acquire a client returns four dollars or more over time. Falling below a 2:1 ratio is a red flag, suggesting your practice might be losing money on new patient acquisition.
| LTV:CAC Ratio | Status | What It Means |
|---|---|---|
| 4:1 or higher | Healthy | Marketing efforts are profitable, fueling sustainable growth |
| 2:1–3.9:1 | Warning | Barely covering costs, with limited profit margins |
| Under 2:1 | Crisis | Marketing costs outweigh revenue, causing financial strain |
Tracking LTV manually can be a nightmare, especially when your data lives in separate systems like scheduling software, POS, and EMR platforms. This is where tools like Prospyr come in handy. By centralizing your data, these platforms give you real-time insights into LTV trends and help identify which services or providers are building the strongest client connections.
Next, we'll dig into how streamlining appointment booking can further boost your revenue potential.
5. Appointment Booking and Calendar Utilization
Empty slots in your schedule don’t just sit there harmlessly - they actively drain revenue. Every unfilled appointment represents wasted provider hours and unrealized earnings.
To dig deeper into this issue, consider tracking revenue per provider hour. This metric measures how effectively your team’s working hours - whether spent on treatments, administrative tasks, or unbooked time - translate into income. The industry benchmark for billable time is 75%–80% of total clocked hours. Top-performing med spas achieve a 78% staff utilization rate, while the average practice lags at just 47%.
One major issue that often flies under the radar is schedule contamination. This happens when high-cost providers handle services that could easily be performed by lower-cost staff.
"A 90-minute facial on an injector who could have done three neurotoxin appointments in that same window is not flexibility, it is value destruction." - Ward Advisory
Aligning provider skills with service types is critical for maximizing revenue. For instance, a skilled injector (MD/DO) should ideally generate $600–$800 per provider hour by 2026. If that same injector is performing basic facials instead, your revenue per hour will likely plummet. Falling below $250 per provider hour signals a serious problem.
Being able to spot and address these inefficiencies is what separates proactive business owners from the rest. The best med spas keep their gap rate - the percentage of unbookable time slots - below 10%, while the industry average hovers between 20%–35%. Tools like Prospyr make it easier to identify and fix these gaps by centralizing scheduling data and offering real-time analytics. This way, you can address underperforming slots before they snowball into significant revenue losses.
Here’s a quick look at the key metrics:
| Metric | Healthy Range | Warning Zone | Crisis Threshold |
|---|---|---|---|
| Revenue per Provider Hour | $350–$425+ | $250–$349 | Under $250 |
| Billable Time % | 75%–80% | 60%–74% | Under 60% |
| Gap Rate (Schedule Density) | Under 10% | 10%–20% | 20%–35%+ |
| Staff Utilization Rate | 78%+ | 60%–77% | Under 47% |
Understanding how provider hours are utilized is a crucial step toward boosting revenue and operational efficiency.
6. No-Show and Cancellation Rate
Minimizing no-shows and cancellations is just as important as efficient appointment scheduling. These issues not only waste valuable provider time but also cut into potential revenue. Knowing where and how these losses occur helps you focus on areas that need improvement.
Cancellations can have varying levels of impact. For instance, losing a $700 filler appointment hurts your bottom line much more than a missed $100 facial. By tracking cancellations based on their dollar value, you can better understand their true effect on revenue. Additionally, examining patterns - like higher no-show rates on Mondays or frequent cancellations from Instagram ad leads compared to referrals - can reveal specific trends worth addressing.
Strive to keep your no-show rate under 5% and your total cancellation rate below 10%. For comparison, no-show rates in the broader healthcare sector range from 11.2% to 57.3%, so staying well below these figures is critical for maintaining profitability in your med spa.
To reduce these losses, consider implementing a few key strategies:
- Require deposits for higher-priced services to encourage commitment.
- Send automated SMS and email reminders 24–48 hours before appointments.
- Include a one-click rescheduling option in confirmation messages for added convenience.
Tools like Prospyr can help streamline these efforts by automating reminders and offering real-time insights into cancellation trends. This allows you to identify patterns by service type or lead source and re-engage clients before they’re lost.
| Metric | Healthy Range | Warning Zone | Crisis Threshold |
|---|---|---|---|
| No-Show Rate | < 5% | 5%–10% | > 11.2% |
| Cancellation Rate | < 10% | 10%–15% | > 20% |
| Rebooking Rate | 60%+ | 40%–59% | < 40% |
sbb-itb-02f5876
7. Client Acquisition Cost (CAC)
Client Acquisition Cost (CAC) is a straightforward calculation: divide your total marketing expenses by the number of new clients you bring in during the same period. For example, if you spent $5,000 on ads and consultations in May and gained 25 new clients, your CAC would be $200 per client. This figure is only sustainable if paired with a Lifetime Value (LTV):CAC ratio of at least 4:1. Anything lower could signal future revenue challenges.
In today's competitive market, aim for that 4:1 ratio or higher. Ratios between 2:1 and 3.9:1 suggest you're operating on thin margins, while anything below 2:1 indicates you're losing money on client acquisition.
"If you're spending $200 to acquire a client who only spends $300 total, you're breaking even at best." - CorralData
| LTV:CAC Ratio | Status | What It Means |
|---|---|---|
| 4:1 or higher | Healthy | Profitable, sustainable growth |
| 2:1 to 3.9:1 | Warning | Covering costs, but thin margins |
| Under 2:1 | Crisis | Acquisition is costing more than it returns |
One common mistake is underestimating CAC by excluding labor costs for non-converting consultations. Whether it's front-desk staff or injectors handling these consultations, their time is part of your acquisition expenses. Ignoring these costs gives you an overly optimistic - and inaccurate - CAC figure.
To get a clearer picture, use practice analytics tools like those offered by Prospyr. These tools can do more than just calculate your overall CAC; they can pinpoint which marketing channels are actually converting leads into paying clients. For instance, if Instagram generates 100 leads but only 5 book appointments, while referrals convert at 30%, the data shows where your budget should go. As CorralData aptly notes, "Traffic is cheap. Bookings are not."
Shifting your focus to high-performing channels and building a referral program can significantly lower your CAC. Referred clients often come with minimal acquisition costs and arrive with built-in trust, making them more likely to convert. By using these insights to fine-tune your marketing strategy, you set the stage for stronger growth and better profitability in your med spa.
8. Retail-to-Service Revenue Ratio
The retail-to-service revenue ratio measures how product sales stack up against clinical treatment revenue. To calculate it, use this formula: (total retail sales ÷ total service sales) × 100.
Why does this matter? Retail sales are a fantastic way to boost revenue per visit without requiring additional provider time. With the U.S. medical spa industry approaching $18 billion in annual revenue, strong retail programs can push the average ticket past $600, compared to the usual $450–$600 range. This metric complements other performance measures by adding revenue streams without overburdening your team.
"Retail isn't about inventory - it's about extending outcomes. Track how often service clients also purchase at-home care or supplements." - CorralData
If your ratio is low, it often points to a training issue. Providers might not be effectively connecting product recommendations to clinical results, which can discourage client purchases. One simple fix? Train your team to recommend a specific product immediately after a treatment. Explain how it supports their results and guide clients toward the retail display. Ward Advisory emphasizes this approach, saying, "Medical-grade skincare should be a standard part of every treatment plan, not an afterthought at the front desk".
Tracking this manually can be a hassle and prone to errors. Tools like Prospyr’s practice analytics simplify the process by automatically calculating your retail attach rate - how often a service visit includes a product purchase. It even breaks it down by provider, helping you spot who might need extra coaching and which treatments pair well with retail. These insights allow you to create smarter treatment bundles and maintain a balanced revenue mix.
9. Membership and Recurring Revenue Performance
Membership programs create a steady stream of monthly income, offering stability for cash flow while enhancing the financial health of your practice. These programs aren't just about the dues - they also encourage client loyalty and repeat visits.
"Memberships are one of the best ways to build recurring revenue for your medspa, both from the membership dues themselves and from the fact that members are more likely to keep coming back."
To ensure your membership program is pulling its weight in your revenue mix, keep an eye on these key metrics:
- Membership churn: This is the percentage of canceled subscriptions. A rising churn rate could be a red flag for client dissatisfaction.
- Breakage rate: The percentage of unredeemed benefits. Ideally, this should fall between 18% and 35%. A rate below 15% might signal over-utilization, which could eat into your margins.
- Deferred revenue coverage ratio: Keep prepaid obligations below 30% of your total cash to maintain financial balance.
Another critical figure to track is Membership Gross Margin - calculated by subtracting the costs of services and discounts from your membership revenue. This metric reveals whether your program is driving profits or simply offsetting discounted treatments. As CFO Pro Analytics emphasizes, "Memberships should be profit engines, not subsidies."
When monitored effectively, these metrics can significantly impact your bottom line, potentially increasing EBITDA by 8–20% and raising average ticket values to over $600.
To simplify the process, tools like Prospyr's membership management software can automate recurring billing and provide real-time insights into metrics like churn, utilization, and deferred revenue. This turns raw data into actionable strategies for growth.
10. Revenue Per Provider and Staff Utilization
Expanding on the earlier discussion about scheduling and provider hours, this metric takes it a step further by focusing on team profitability. It’s not just about how busy your team is - it’s about how profitable their time is. That’s where revenue per provider hour comes into play. This metric is a straightforward way to gauge productivity and profitability across your team.
"It's not just who's busy - it's who's profitable. Measuring revenue per provider hour gives you a true apples-to-apples look at your team's output." - CorralData
To calculate revenue per provider hour, divide the total revenue generated by all hours worked, including admin time and idle periods - not just the hours spent in treatment rooms. This approach creates a standardized way to compare performance, whether someone is full-time or part-time. The table below outlines healthy revenue targets for different roles, making it easier to plan schedules and maximize revenue:
| Provider Role | Healthy Revenue per Hour |
|---|---|
| Injector (MD/DO) | $600–$800 |
| Nurse Practitioner (NP) | $450–$600 |
| Physician Assistant (PA) | $400–$550 |
| Esthetician | $150–$250 |
Staff utilization rates are another critical piece of the puzzle. Ideally, your team should operate at 75% to 90% utilization. If it falls below 75%, it points to underutilization - essentially, wasted labor costs that could be addressed with better scheduling or marketing strategies. On the other hand, exceeding 90% can lead to burnout, which isn’t sustainable in the long run.
When you notice discrepancies - like a provider handling a high volume of clients but generating less revenue than expected - it’s often a chance to coach them. This might involve improving their upselling or cross-selling techniques or tweaking their service mix to include more high-margin treatments. Tools like Prospyr’s practice analytics provide real-time insights into these patterns, enabling you to make data-driven adjustments before inefficiencies start to eat into your bottom line.
How Practice Analytics and Automation Help You Track These Metrics
When it comes to tracking the key metrics outlined earlier, automation takes the guesswork out of decision-making by turning raw data into clear, actionable insights.
Trying to track 10 metrics manually - spread across spreadsheets, scheduling tools, and payment systems - can quickly become overwhelming. This approach often leads to fragmented, outdated data, making it hard to make informed decisions. In fact, 51% of organizations without automated performance systems report issues with data accuracy and decision-making. That’s a big challenge if your goal is to grow revenue and improve efficiency.
A centralized platform like Prospyr solves this problem by pulling data from your CRM, EMR, scheduling, and financial systems into one unified hub. It eliminates the need for manual calculations and consolidates everything into real-time dashboards. This means you can act quickly and confidently, with all the information you need at your fingertips. Dr. Ahmed El Houssieny, Founder and Medical Director of Bank MediSpa, highlights the importance of this kind of visibility:
"I'm always looking at my clinic in terms of growth. I'm aiming for 10, 20, 30% growth. It's important for me to access data that shows me how I'm doing."
Automation doesn’t just make your data easier to understand - it improves your daily operations. For example, Prospyr automates SMS and email follow-ups to improve patient retention and tracks metrics like recurring revenue, churn rates, and unredeemed benefits without any extra manual effort. Its scheduling tools flag calendar gaps in real time, helping you maintain a schedule gap rate below 10%, compared to the industry average of 20–35%.
These kinds of improvements can have a big impact on your bottom line, potentially increasing EBITDA by 8–20% in the first year - without needing to spend more on marketing. The table below illustrates how Prospyr’s features align with the metrics discussed earlier:
| Prospyr Feature | Metrics It Supports |
|---|---|
| CRM/EMR Integration | Patient LTV, Retention Rate, CAC |
| Real-Time Analytics | Revenue per Provider, Average Revenue per Visit |
| Marketing Automation | Patient Retention Rate, Client Acquisition Cost |
| Membership Management | Recurring Revenue, Membership Churn |
| Scheduling Tools | Calendar Utilization, No-Show Rate, Staff Utilization |
Conclusion
Tracking the right metrics turns guesswork into informed decision-making. Metrics like revenue, retention, utilization, and acquisition costs may not paint the full picture individually - but when combined, they clearly show where your practice is excelling and where it might be losing money under the radar.
The numbers matter. A well-run med spa typically generates $1.4 million in annual revenue, with profit margins ranging from 20% to 25%. However, those margins can shrink quickly due to issues like no-shows, underutilized staff, or rising client attrition. Keeping a close eye on metrics ensures these problems are addressed before they become costly.
As Kendall Reed from Maven Financial Partners explains:
"KPIs are an extremely important part of understanding any business. They aren't worth a whole lot if they aren't being considered or analyzed before making business decisions."
Make it a habit to review key metrics regularly: check bookings and no-shows daily, evaluate service performance and retail sales weekly, and analyze financial and retention trends monthly. This routine empowers you to make sharper, faster decisions. Over time, this disciplined approach paves the way for leveraging centralized analytics.
Platforms like Prospyr make it easier to consolidate and analyze these insights, giving you a unified view of your practice’s performance. With this clarity, you can focus on what matters most - growing your business.
FAQs
What 3 metrics should I track first if I’m starting from scratch?
If you're just getting your med spa off the ground, start by keeping an eye on total revenue, appointment booking trends, and profit margin. These three metrics give you a straightforward view of your clinic's financial performance and operational efficiency. As your business expands, tools like Prospyr can simplify the process by combining this data into a user-friendly dashboard. This makes it easier to shift your focus to more advanced metrics, such as client lifetime value and retention rates.
How can I calculate LTV and CAC accurately?
To figure out your Customer Acquisition Cost (CAC), simply divide your total marketing and sales expenses by the number of new patients you brought in during a specific time frame. For Lifetime Value (LTV), the formula is just as straightforward: multiply the average revenue per visit by the number of visits per year, then multiply that by the average client lifespan in years.
Prospyr’s built-in practice analytics can handle these calculations automatically, providing real-time data to ensure you maintain an ideal 3:1 LTV to CAC ratio.
What should I fix first if my revenue per visit is low?
If your revenue per visit isn’t meeting expectations, take a closer look at how each service category is performing. Break down your revenue by treatment type to spot which services are driving profits and which ones might be falling short. This can reveal opportunities to create service bundles or introduce premium upgrades that add value for clients and increase earnings.
It’s also worth reviewing how efficiently your schedule is being managed and whether providers are focusing on the most profitable procedures. Tools like Prospyr’s practice analytics allow you to monitor these metrics in real time, helping you make informed decisions to refine your offerings and improve revenue outcomes.