Running a clinic requires tracking two key financial indicators: revenue metrics and profitability metrics. Here's the difference:
- Revenue Metrics: Measure total income from services, treatments, and retail sales. These show how much money is coming in but don’t account for costs.
- Profitability Metrics: Focus on what’s left after expenses like wages, consumables, and overhead. These reveal how efficiently your clinic operates and whether it’s truly making money.
Key Takeaways:
- High revenue doesn’t always mean high profit. A clinic earning $100,000 in revenue but keeping only $10,000 in profit is less efficient than one earning $75,000 but keeping $40,000.
- Revenue metrics like Revenue Per Hour (RPH) highlight productivity and pricing effectiveness. For example, treatment rooms should aim for $600–$1,000+ per hour.
- Profitability metrics like Gross Margin (target: 75%+) and Labor Cost Percentage (target: under 45%) help identify cost inefficiencies and ensure financial sustainability.
- Both metrics are essential. Revenue shows growth, while profitability ensures survival.
Quick Comparison:
| Feature | Revenue Metrics | Profitability Metrics |
|---|---|---|
| Definition | Total income before expenses | Earnings after all costs |
| Primary Focus | Sales volume and pricing | Cost control and efficiency |
| Key Formulas | Price × Volume; RPH | (Revenue - Expenses) / Revenue |
| Insights Provided | Patient demand and provider output | True financial health |
| Limitations | Ignores costs and efficiency | Doesn’t show growth potential |
Tracking both metrics helps clinics make smarter financial decisions, improve efficiency, and ensure long-term success. Using integrated clinic analytics simplifies this process by centralizing data for real-time reporting.
Revenue Metrics: What They Are and How They Work
What Are Revenue Metrics?
Revenue metrics represent your clinic's gross income. They capture the total earnings from services, treatments, and retail sales, offering a way to pinpoint high-demand treatments, assess pricing strategies, and evaluate provider productivity.
Unlike profitability metrics, revenue metrics don't factor in costs like consumables and inventory, labor, or overhead. They focus on top-line income, making them useful for spotting growth trends and assessing the performance of specific treatments or providers. However, they don't reveal whether your clinic is actually profitable.
Let’s dive into some of the most common revenue metrics and how they quantify income streams.
Common Revenue Metrics for Aesthetic Clinics
Revenue Per Hour (RPH) tracks the income generated per hour by a treatment room or provider. Terri Ross, Founder of APX Platform, explains its importance:
"Revenue per hour... gives you insight into your pricing. It will answer whether or not you are aligned with your market or whether you are charging too little".
In a thriving medical spa, a treatment room should ideally generate between $600 and $1,000+ per hour, compared to the industry average of $425 per hour. For aesthetician rooms, revenue typically ranges from $250 to $350 per hour (including retail sales). Surgical practices, on the other hand, should aim for over $3,000 per hour.
Revenue per service category measures income from specific treatments like injectables, laser procedures, or facials. Monitoring this metric over time helps identify top-performing treatments and underperformers. For example, Olam Med-Spa in Florida saw a 485% revenue increase from 2019 to 2020 by implementing financial strategies and tracking key performance indicators.
Additional metrics include total monthly or annual revenue and revenue per patient. Clinics also examine Customer Acquisition Cost (CAC) to gauge marketing effectiveness using embedded marketing tools and Lifetime Value (LTV) to estimate the total revenue a patient generates throughout their relationship with the clinic.
While these metrics effectively measure scale, they don't address cost efficiency, which is vital for financial health.
What Revenue Metrics Don't Tell You
Revenue metrics, while insightful, don't account for the cost of goods sold (COGS) or labor. A treatment might bring in significant income but still fail to turn a profit if expenses are too high. For instance, if your clinic's gross profit margin falls below 50%, you might only be breaking even.
High revenue figures can be deceiving. A clinic might fill its schedule with low-margin treatments that barely cover costs. Revenue metrics highlight scale but fail to address efficiency or long-term viability. To get a complete picture of financial health, it's crucial to track profitability metrics alongside revenue. This combined approach enables smarter business decisions and a more sustainable strategy.
sbb-itb-02f5876
Profitability Metrics: What They Are and How They Work
What Are Profitability Metrics?
Profitability metrics measure your clinic's actual financial performance by subtracting expenses from revenue. They reveal your true profit margins after factoring in costs like materials, labor, and overhead. These metrics answer the fundamental question: Is your clinic genuinely profitable? High revenue alone doesn’t guarantee financial success. For instance, a treatment room might generate impressive income, but if operating costs are excessive, the resulting profit could be negligible. As Aesthetic.Consulting aptly puts it:
"Instagram followers and raw lead volume do not pay your staff. Focus on the metrics that private equity buyers actually review during acquisition".
Private equity buyers often focus on profitability metrics like EBITDA margin and gross profit instead of vanity metrics. Whether you're planning to sell, expand, or simply maintain financial stability, understanding these numbers is critical. Below, we break down the key profitability metrics every aesthetic clinic should track.
Common Profitability Metrics for Aesthetic Clinics
Revenue metrics might show income, but profitability metrics dig deeper into operational efficiency.
- Gross Margin Percentage (GM%): This metric evaluates how efficiently you manage the cost of injectables and medical supplies. It’s calculated as (Revenue - Material COGS) / Revenue. A strong Gross Margin should exceed 75%, with top-performing clinics aiming for 92%. Ideally, material costs for fillers and neurotoxins should stay under 10% of the service price.
-
Gross Profit: This figure represents revenue minus the costs of goods sold (COGS) and labor. Often called the "contribution margin", it shows what’s left to cover fixed expenses like rent and utilities. As Terri Ross, Founder of APX Platform, explains:
"If your gross profit is not 50% or greater, you may just be breaking even or worse".
- Practitioner Labor Cost Percentage: This tracks the portion of revenue spent on wages and commissions. Practitioner labor, often one of the largest expenses, typically starts at 40% of revenue. To maintain profitability, total labor costs should stay below 45%.
- Fixed Overhead Coverage Ratio: This metric identifies the minimum treatment volume needed to cover fixed costs like lease payments and base salaries. For example, new clinics in 2026 may face fixed overhead costs of about $19,600 per month, requiring careful planning to break even.
- Patient Lifetime Value (LTV): LTV estimates the total revenue a patient generates over their time with your clinic. It guides how much you can afford to spend on acquiring new customers. A sustainable LTV should be at least three times your Customer Acquisition Cost (CAC).
What Profitability Metrics Don't Tell You
While these metrics are essential for understanding financial efficiency, they don’t paint the full picture. For example, profitability metrics alone won’t reveal growth potential or revenue trends. High margins might indicate efficiency, but they could also signal rushed appointments or quality compromises to meet targets.
Additionally, LTV can be tricky for new clinics. Early-stage practices often overestimate patient retention, which can obscure immediate cash flow challenges if acquisition costs are too high. These metrics also don’t account for external factors like market demand or competition - both critical for long-term success.
When paired with revenue data, profitability metrics give you a more complete view, helping you make smarter financial decisions.
How Revenue and Profitability Metrics Differ
Revenue vs Profitability Metrics for Aesthetic Clinics Comparison Chart
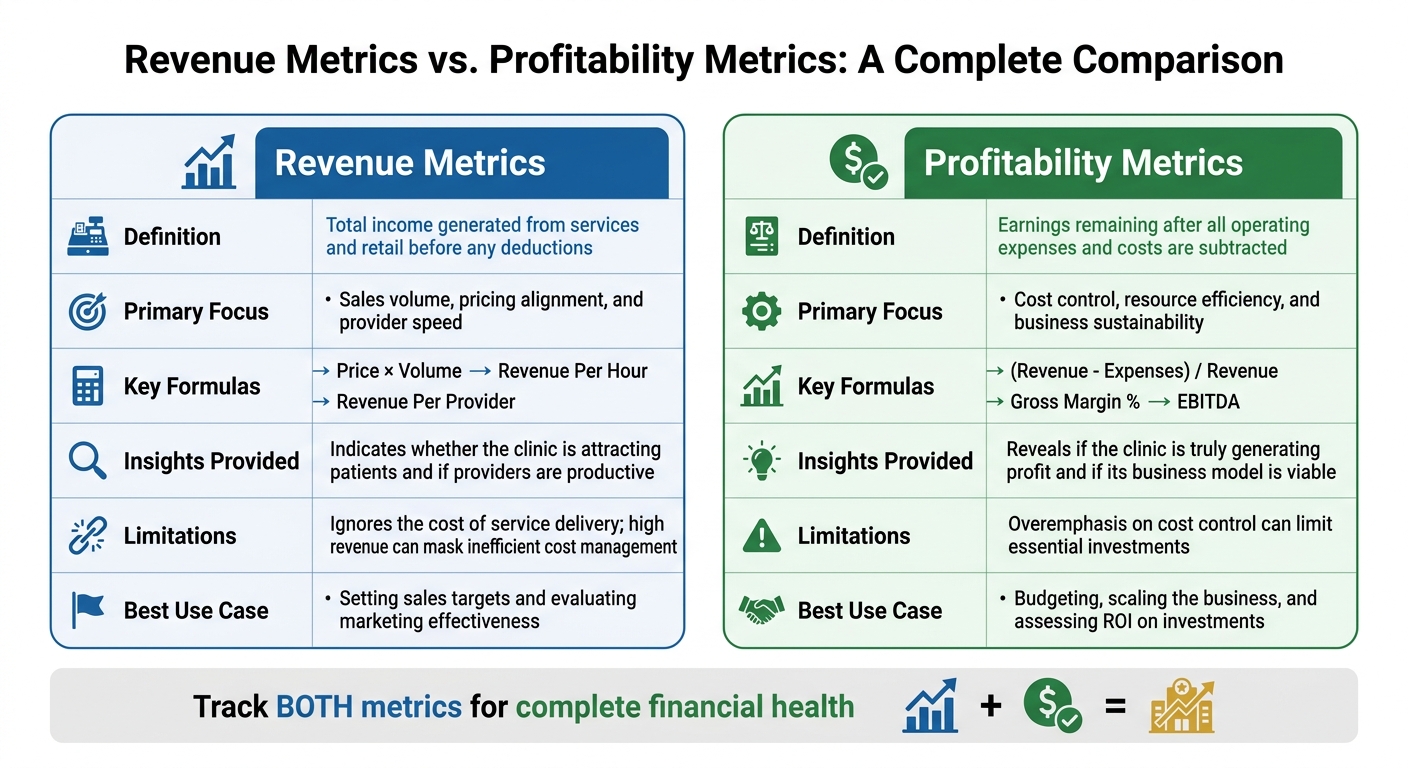
Side-by-Side Comparison: Revenue vs. Profitability Metrics
Revenue metrics capture the total income your business generates, while profitability metrics focus on what’s left after all expenses are deducted. In other words, revenue metrics track your top line - the total income from services and retail before any deductions - offering insights into pricing, provider efficiency, and market demand. On the other hand, profitability metrics show the bottom line, revealing whether your business model is financially viable after accounting for costs.
This distinction matters because a high revenue doesn’t always guarantee financial stability. For instance, a treatment room might bring in $800 per hour, aligning with industry benchmarks. However, if 60% of that income goes toward labor and product costs, the remaining profit might not be enough to cover fixed expenses like rent or utilities.
Here’s a closer look at how these metrics compare:
| Feature | Revenue Metrics | Profitability Metrics |
|---|---|---|
| Definition | Total income generated from services and retail before any deductions | Earnings remaining after all operating expenses and costs are subtracted |
| Primary Focus | Sales volume, pricing alignment, and provider speed | Cost control, resource efficiency, and business sustainability |
| Key Formulas | Price × Volume; Revenue Per Hour; Revenue Per Provider | (Revenue - Expenses) / Revenue; Gross Margin %; EBITDA |
| Insights Provided | Indicates whether the clinic is attracting patients and if providers are productive | Reveals if the clinic is truly generating profit and if its business model is viable |
| Limitations | Ignores the cost of service delivery; high revenue can mask inefficient cost management | Overemphasis on cost control can limit essential investments |
| Best Use Case | Setting sales targets and evaluating marketing effectiveness | Budgeting, scaling the business, and assessing ROI on investments |
By comparing these metrics, you can better understand how they align with different aspects of your business operations.
Real Clinic Examples
Looking at real-world examples helps clarify how these metrics influence financial health.
Take a primary care clinic projected for 2026. It generates $300,000 in monthly revenue, but with a Cost of Goods Sold (COGS) of 80% - equal to $240,000 - its gross margin is only 20%. To reach a more sustainable gross margin target of 90%, the clinic would need to slash variable costs by $210,000 each month. This example demonstrates how impressive revenue numbers can hide underlying financial challenges.
Another scenario involves a clinic with projected annual wage expenses of $795,000 in 2026. To maintain a labor cost percentage of 40%, the clinic would need to achieve at least $1,987,500 in annual revenue. If revenue falls short, the clinic might appear successful based on revenue metrics, but profitability metrics would reveal it’s struggling to cover its operational costs.
These examples show how balancing both revenue and profitability metrics is essential for long-term success. They allow clinic owners to identify areas for improvement and make informed decisions to strengthen their financial footing.
Using Both Metrics to Make Better Decisions
Why You Should Track Both Metrics
Keeping an eye on both revenue and profitability metrics helps you avoid the mistake of focusing only on surface-level figures like top-line revenue or social media stats. Revenue metrics reveal how well you’re engaging patients and pricing your services, while profitability metrics give you a clear picture of your clinic's long-term financial health.
By tracking both, you can spot and fix issues quickly. For instance, if your Revenue Per Hour (RPH) drops below the target of $850 but your patient retention rate stays steady at 65%, the problem might lie in your pricing strategy or service offerings rather than patient satisfaction. This level of detail is invaluable during quarterly financial reviews, allowing you to make adjustments before small issues become big problems.
This approach is especially important if you’re planning to sell your clinic or attract investors. Potential buyers are more interested in solid profitability metrics than just high revenue numbers. As Aesthetic.Consulting puts it, "The aesthetic industry is data-rich but insight-poor". By tracking both metrics, you not only make smarter business decisions but also position your clinic as a valuable asset.
How Practice Management Software Helps Track Metrics
Managing both metrics can be tricky, but practice management software makes it much easier. Relying on spreadsheets to track data - like calculating Cost of Goods Sold (COGS) for every invoice - can lead to mistakes and wasted time. Tools like Prospyr simplify this process by automating data collection and calculations across your clinic. With features like real-time analytics and dynamic dashboards, you can instantly see how your revenue and profitability metrics are performing as transactions happen.
Instead of spending hours compiling data manually, you can set up the system to generate “flash reports” that highlight key performance indicators. For example, these reports can show metrics like RPH (targeting $850+), retention rates (aiming for 65%+), and gross margins (75%+), giving leadership a quick and accurate overview without the hassle of manual entry.
Prospyr goes further by integrating CRM/EMR tools, scheduling, and payment processing, capturing all the data you need - from service revenue to product costs and labor expenses. The platform also lets you break down data by individual provider, not just clinic-wide averages. This helps you identify team members who might need extra training or support. With this kind of detailed, automated tracking, you can take control of your clinic’s financial health like never before.
Conclusion
By 2026, running a thriving aesthetic clinic will require understanding the difference between revenue growth and profitability. High revenue can be misleading if hefty costs eat into your margins. As Aesthetic.Consulting warns, clinics can fall into the "Vanity Trap", where impressive sales figures fail to cover fixed costs or generate meaningful cash flow.
This distinction between revenue and profit is crucial for both day-to-day operations and long-term planning. Revenue shows pricing and demand trends, while profitability reflects the clinic's financial health. This becomes even more critical if you're considering selling your clinic or attracting investors. As Aesthetic.Consulting explains, "A private equity firm looking to acquire your practice will immediately discard your social metrics. They evaluate your Revenue Per Hour (RPH) per room, your EBITDA margin, and your patient retention cohorts".
To maintain balance, it's important to keep practitioner labor costs under 45%, ensure patient retention stays above 65%, and aim for an LTV-to-CAC ratio of at least 3:1. This ensures that the cost of acquiring a patient remains much lower than the revenue they bring in over time.
Incorporating these metrics with smart tools can transform clinic management. Solutions like Prospyr automate data collection and reporting, offering a clear financial overview. This approach supports better decision-making, helps control costs, and ensures your clinic is not only busy but also profitable.
FAQs
Which 3 metrics should I track first in my clinic?
When it comes to running a successful clinic, keeping an eye on the right metrics can make all the difference. Here are three key ones to focus on:
- Client Retention Rate: This metric reflects how loyal your clients are and how often they return for services. A healthy retention rate typically falls between 80% and 90%, signaling strong relationships and consistent care.
- Average Revenue Per Client (ARPC): This helps you understand how much revenue each patient brings in on average. Clinics usually see figures ranging from $500 to $2,000, depending on the services offered.
- New Client Acquisition Rate: This shows how effective your marketing efforts are at bringing in fresh faces. In healthcare, conversion rates generally hover around 55% to 75%.
By tracking these metrics, you can build a solid strategy to boost performance, grow revenue, and achieve long-term success.
How do I calculate Revenue Per Hour per room or provider?
To figure out Revenue Per Hour for a room or provider, you simply divide the total revenue earned during a given period by the total hours the room or provider was in use.
For instance, if a room brings in $800 in one hour, that amount represents its Revenue Per Hour. This metric is a handy way to assess efficiency and profitability, helping identify areas where operations could be optimized.
What should I do if my revenue is up but profit is down?
If your revenue is climbing but your profit is shrinking, it’s a sign that increasing costs or inefficiencies might be eating into your growth. Take a close look at your expenses - things like supplies, labor, and overhead - to pinpoint areas that could be streamlined.
Pay special attention to profitability metrics like net profit margin. These figures give you a clearer picture of whether your growth is sustainable over the long term. Tools such as Prospyr can be incredibly helpful here, allowing you to monitor key performance indicators (KPIs) in real time. This makes managing both costs and revenue far more efficient.