
In the competitive world of aesthetic medicine, data isn't just helpful - it's your edge. Practices using real-time analytics are spotting trends early, tailoring services, and meeting patient demands faster than ever. Here's why it matters:
- Market Growth: Non-surgical aesthetics spending in the U.S. jumped from $17.79 billion in 2022 to $20.44 billion in 2024.
- Patient Insights: Gen Z's growing influence (from 4% in 2017 to 10% in 2024) is driving trends like "prejuvenation."
- Retention Boost: 97% of medspa clients rebook when offered personalized options.
This guide breaks down how to centralize patient data, create real-time dashboards, predict demand, and refine services to stay ahead. By leveraging tools like integrated CRM/EMR systems and AI-powered analytics, you can shift from reactive decisions to smarter, data-informed strategies. Ready to learn how? Let’s dive in.
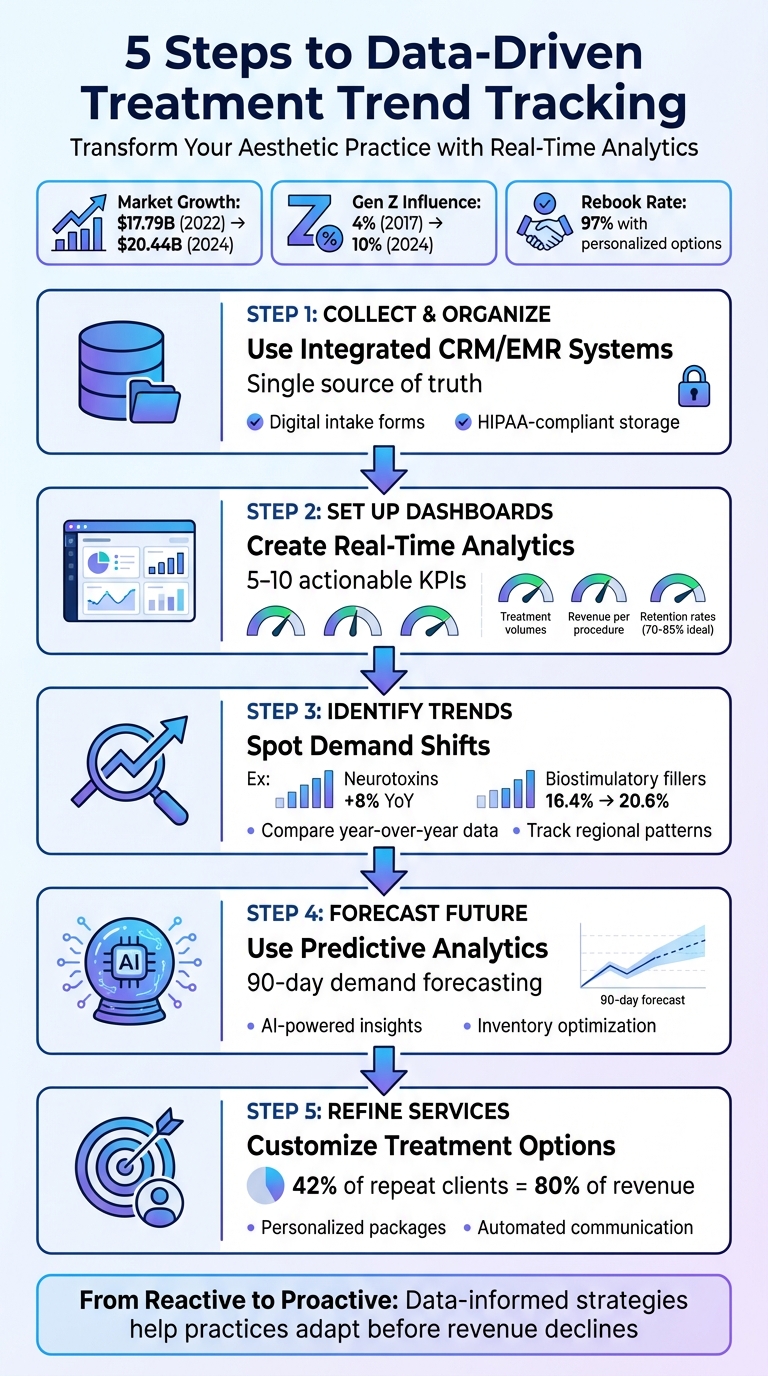
5-Step Data-Driven Treatment Trend Tracking Process for Aesthetic Practices
Step 1: Collect and Organize Patient Data
To effectively track treatment trends, having all patient data in a single, unified system is essential. When information is scattered across spreadsheets, paper records, and disconnected software, it’s easy to miss critical patterns. Consolidating this data lays the groundwork for regular audits, ensuring its integrity. A combined CRM and EMR system is key to capturing every patient interaction in one place.
Use Integrated CRM/EMR Systems for Data Management
An integrated CRM/EMR system brings together data from multiple touchpoints - phone calls, text reminders, consultations, treatment notes, billing records, and even before-and-after photos. This approach not only reduces manual errors but also ensures every interaction is documented seamlessly. Digital intake forms, which patients can fill out online, automatically sync with their charts for added efficiency.
A notable example of this integration came in September 2025, when Aesthetix CRM partnered with CorralData. This collaboration connects CRM lead data with EMR systems like Zenoti and ModMed. According to Eric Dunn, CEO of Aesthetix CRM, and Alex Lirtsman, CEO of CorralData, the partnership offers medical spas a HIPAA-compliant dashboard that tracks the entire patient journey - from initial lead to clinical care. It even uses AI-powered campaigns to identify patients who may be at risk.
"The first step to automating your aesthetic care practice is creating a single source of truth in a combined EMR-CRM system." – AdVital MD
Customizable templates for different procedures - like neurotoxins, fillers, and laser treatments - help ensure that critical details such as medical history, allergies, lot numbers, and dosages are consistently recorded. Modern systems also offer secure, cloud-based storage with timestamped entries and audit logs, making it easy to track access and modifications.
Once the systems are integrated, routine audits of the data ensure its accuracy and reliability over time.
Ensure Data Accuracy and Completeness
No matter how advanced the system, its effectiveness depends on the quality of the data it holds. Regular audits can help identify issues like missing allergy information, incomplete treatment notes, or outdated contact details. Assigning a dedicated staff member to oversee data accuracy and establishing clear data-entry policies can further enhance reliability.
AI-powered documentation tools are another way to improve data quality while saving time. For instance, Kaiser Permanente saved 15,700 hours in 2024 by using such tools.
Structured data fields also make it easier to analyze trends. Instead of entering freeform notes like "patient wants Botox for forehead lines", dropdown menus for treatment area, product type, and units administered ensure consistency. Additionally, linking injectable inventory to patient records allows automatic tracking of lot numbers and expiration dates, supporting both safety compliance and accurate product usage. Accurate and complete data not only facilitates billing and compliance but also uncovers emerging trends in patient care.
sbb-itb-02f5876
Step 2: Set Up Practice Analytics Dashboards
Once your patient data is consolidated, the next step is to create dashboards that provide real-time insights. These dashboards build on the unified data foundation from Step 1, allowing you to access and act on your data instantly. With a well-structured dashboard, you no longer have to wait until the end of the month to review reports. Instead, you can monitor clinic performance in real time, making on-the-spot adjustments to marketing budgets or staffing as needed. The key is to integrate data from multiple sources into a single, cohesive view.
Dashboards should offer role-specific views to ensure each team member focuses on the data most relevant to them. For example, a "Practice" dashboard might show overall clinic performance, while a "Provider" dashboard enables individual practitioners to track metrics like revenue per hour or rebooking rates. Adding filters by practitioner, location, or timeframe helps you pinpoint trends and identify areas of improvement.
"If you only see at the end of the month that revenue is disappointing, you're too late to make adjustments." – Clinicminds
Key Metrics to Track in Practice Analytics
To avoid overwhelming your team, focus on 5–10 actionable metrics. Here are some essential ones to consider:
- Treatment volumes: See which services are most in demand.
- Revenue per procedure: Understand which treatments generate the most income.
- Patient demographics: Gain insights into who your patients are.
- Retention rates: Measure how many patients return for additional visits (ideally between 70% and 85%).
It's also important to evaluate volume alongside profit margins. A high-volume service might not be as lucrative as a lower-volume one with higher margins. Metrics like revenue per hour offer a clear picture of practitioner efficiency. Other useful data points include:
- Rebooking percentage: Track how quickly patients rebook (ideally within 12 hours).
- Net Promoter Score (NPS): Gauge patient satisfaction.
- Utilization rate: Aim for at least 80% to maintain a healthy clinic.
Visualize Data for Better Insights
Choosing the right metrics is just the beginning - how you display them matters too. Visual tools make trends easier to spot. For instance:
- Line charts: Ideal for identifying trends over time.
- Bar charts: Great for comparing categories.
- Single-number widgets: Perfect for highlighting KPIs like monthly revenue or today's no-show rate.
Organize your dashboard so the most critical KPIs appear at the top, followed by trend visuals and detailed data. Enable drill-down features that let users click on a high-level metric (e.g., total revenue) to see more granular details, such as revenue by service or patient. Keep an eye on your "Top 5" most-used inventory items to align product usage with treatment trends. Including a "Chart Audit" widget ensures that all patient data is complete and accurate, preventing reporting errors.
Finally, set up automated alerts for metrics that exceed healthy thresholds, such as no-show rates above 10% or Days Sales Outstanding over 30 days. These real-time insights will help you spot issues early and take corrective action.
Step 3: Identify and Evaluate Treatment Trends
Once you’ve set up robust dashboards, it’s time to turn raw data into actionable insights about treatment trends. This means digging into what your patients want and where the market is heading. The earlier you can spot these shifts - ideally before they show up in quarterly reports - the better positioned you’ll be to adjust your services and marketing strategies while the opportunity is still fresh.
Spot Shifts in Demand
Start by keeping a close eye on treatment categories to identify which ones are gaining traction and which are losing steam. For example, neurotoxins saw an 8% year-over-year growth in 2024, while energy-based devices experienced a 5% decline. These numbers reflect changing patient preferences. Look at whether biostimulatory injectables, such as Sculptra or Radiesse, are pulling market share away from traditional hyaluronic acid fillers. In 2024, biostimulatory products accounted for 20.6% of dermal filler spending, up from 16.4% in 2022.
Another trend to note is the rising influence of Gen Z, whose share of the market grew from 4% in 2017 to 10% in 2024. This demographic is fueling interest in prejuvenation treatments like neurotoxins and professional-grade skincare. Additionally, practices offering GLP-1 weight-loss medications saw a 9% revenue boost in 2024, while those without these offerings experienced a 2% decline. Nearly 40% of GLP-1 patients were new to these practices.
Analyzing patient behavior can also uncover profitable combinations of treatments. For instance, tracking how often patients return for multiple treatments in a year can reveal patterns worth capitalizing on. Similarly, monitoring inventory - such as retail products or treatment supplies that are moving faster than usual - can highlight shifts in patient preferences.
Once you’ve identified these shifts, comparing trends year-over-year helps confirm whether they’re here to stay or just fleeting.
Compare Trends Over Time
Relying on single data snapshots can be misleading. To understand if a trend is long-term or just a seasonal anomaly, compare year-over-year data. For instance, while hydration treatments might naturally spike before summer, a 20% increase in exosome-related skin rejuvenation procedures compared to the same time last year points to a more lasting shift in demand.
"The quarterly analysis allows clinics to spot patterns in treatment popularity, which can be influenced by various factors such as new aesthetic trends, seasonal changes affecting patient concerns... or the introduction of innovative treatments." – Clinicminds
It’s also worth tracking provider performance over time. If one practitioner consistently excels in specific treatments, it might signal an area of expertise - or highlight a training gap for other team members. This insight can help you allocate staff more effectively during peak seasons. Historical data is equally useful for workforce planning and inventory management. For example, peak treatment periods shifted from January and March to August and September in 2024. Knowing this allows you to adjust staffing and supplies proactively.
Regional analysis adds another layer of insight. Comparing performance across locations or demographics can help you tailor your approach. In 2024, practices in the Midwest achieved 8% same-store revenue growth, outpacing other U.S. regions. If you operate in multiple locations, analyzing regional trends can highlight where demand is strongest and where adjustments might be needed.
Step 4: Forecast Future Trends with Predictive Analytics
After identifying patterns in your historical data, the next logical step is to use those insights to anticipate future trends. Predictive analytics helps you spot demand shifts before they fully take shape, giving you a head start to adjust inventory, staffing, and marketing strategies while the opportunity is still fresh. This forward-thinking approach rounds out your data-driven strategy, allowing you to refine services proactively.
Use AI for Predictive Insights
AI-powered tools excel at analyzing complex datasets, such as patient demographics, treatment histories, and seasonal trends, to detect real-time changes. Predictive analytics uncovers signals in past performance that might otherwise remain hidden.
"Real-time analytics give aesthetic brands a measurable advantage by revealing demand shifts, category performance, and demographic trends long before traditional reporting can catch up." – Guidepoint Qsight
These tools also guide investment decisions. For instance, if data highlights a steady increase in demand for certain injectable treatments or trending skincare products - like the (plated)™ brand, which expanded its market share from 0.7% to 2.4% over two years - you can stock up before demand peaks. This kind of forecasting transforms insights into practical improvements for day-to-day operations.
Practical Applications of Forecasting
With AI-driven insights, forecasting can enhance everyday business operations in several ways. For example, you can predict appointment volumes for the next 90 days to fine-tune staffing schedules, ensuring you’re neither overstaffed nor understaffed during busy or slow periods. If historical data shows a revenue dip in late January, launching targeted promotions a few weeks earlier can help stabilize cash flow during that lull.
Inventory management also becomes more efficient. By tracking real-time product movement and comparing it with past trends, you can adjust stock levels to meet demand while avoiding excess inventory. If your data suggests rising interest in regenerative skincare products in the coming months, you can plan orders to prevent shortages.
Forecasting also uncovers cross-selling opportunities. For example, if analytics reveal that a significant number of new patients are open to trying additional treatments, you can design campaigns to promote complementary services like neurotoxins, fillers, or professional-grade skincare. This kind of proactive strategy turns data insights into actionable revenue opportunities.
Step 5: Refine Service Offerings Based on Insights
Use data to shape services that meet patient needs and elevate their overall experience. By identifying trends and anticipating future demands, you can ensure your practice remains relevant and responsive.
Customize Treatment Options
Data helps shift from one-size-fits-all treatments to care tailored to individual preferences and trends. For instance, if analytics show growing interest among younger patients, you might develop targeted prejuvenation packages to meet their specific needs.
Prescriptive analytics can also guide treatment recommendations. For example, it can identify patients likely to benefit from biostimulatory injectables, a category that saw spending rise from 16.4% to 20.6% of dermal filler expenses. Additionally, tracking cross-treatment behaviors can uncover opportunities to bundle services, such as combining skin tightening with body contouring for patients using GLP-1 medications.
Focus on your most loyal patients to maximize impact. If 42% of repeat clients drive 80% of your revenue, consider offering personalized treatment plans or exclusive memberships to keep this core group engaged.
Improve Patient Experience
Customizing treatments is just one part of the equation - improving every aspect of the patient experience is just as important. Automated, personalized communication can enhance satisfaction and retention. For example, instead of sending generic promotions, use time-to-repeat data to remind patients when it’s time for their next neurotoxin appointment, typically every three to four months.
With over 46% of patients now booking online, creating a smooth digital experience is a must. Centralized patient data can refine your communication efforts further. Automate post-visit surveys and use tools like sentiment analysis to address concerns quickly. Monitor engagement metrics, such as email open rates and text replies, to launch targeted re-engagement campaigns.
Integrating patient data across your CRM, EMR, and communication tools solves the issue of fragmented information. This unified approach gives you a complete view of each patient’s journey - from their first inquiry to their latest treatment - allowing you to deliver consistent, personalized care that encourages loyalty and repeat visits.
Use Prospyr for Data-Driven Trend Tracking
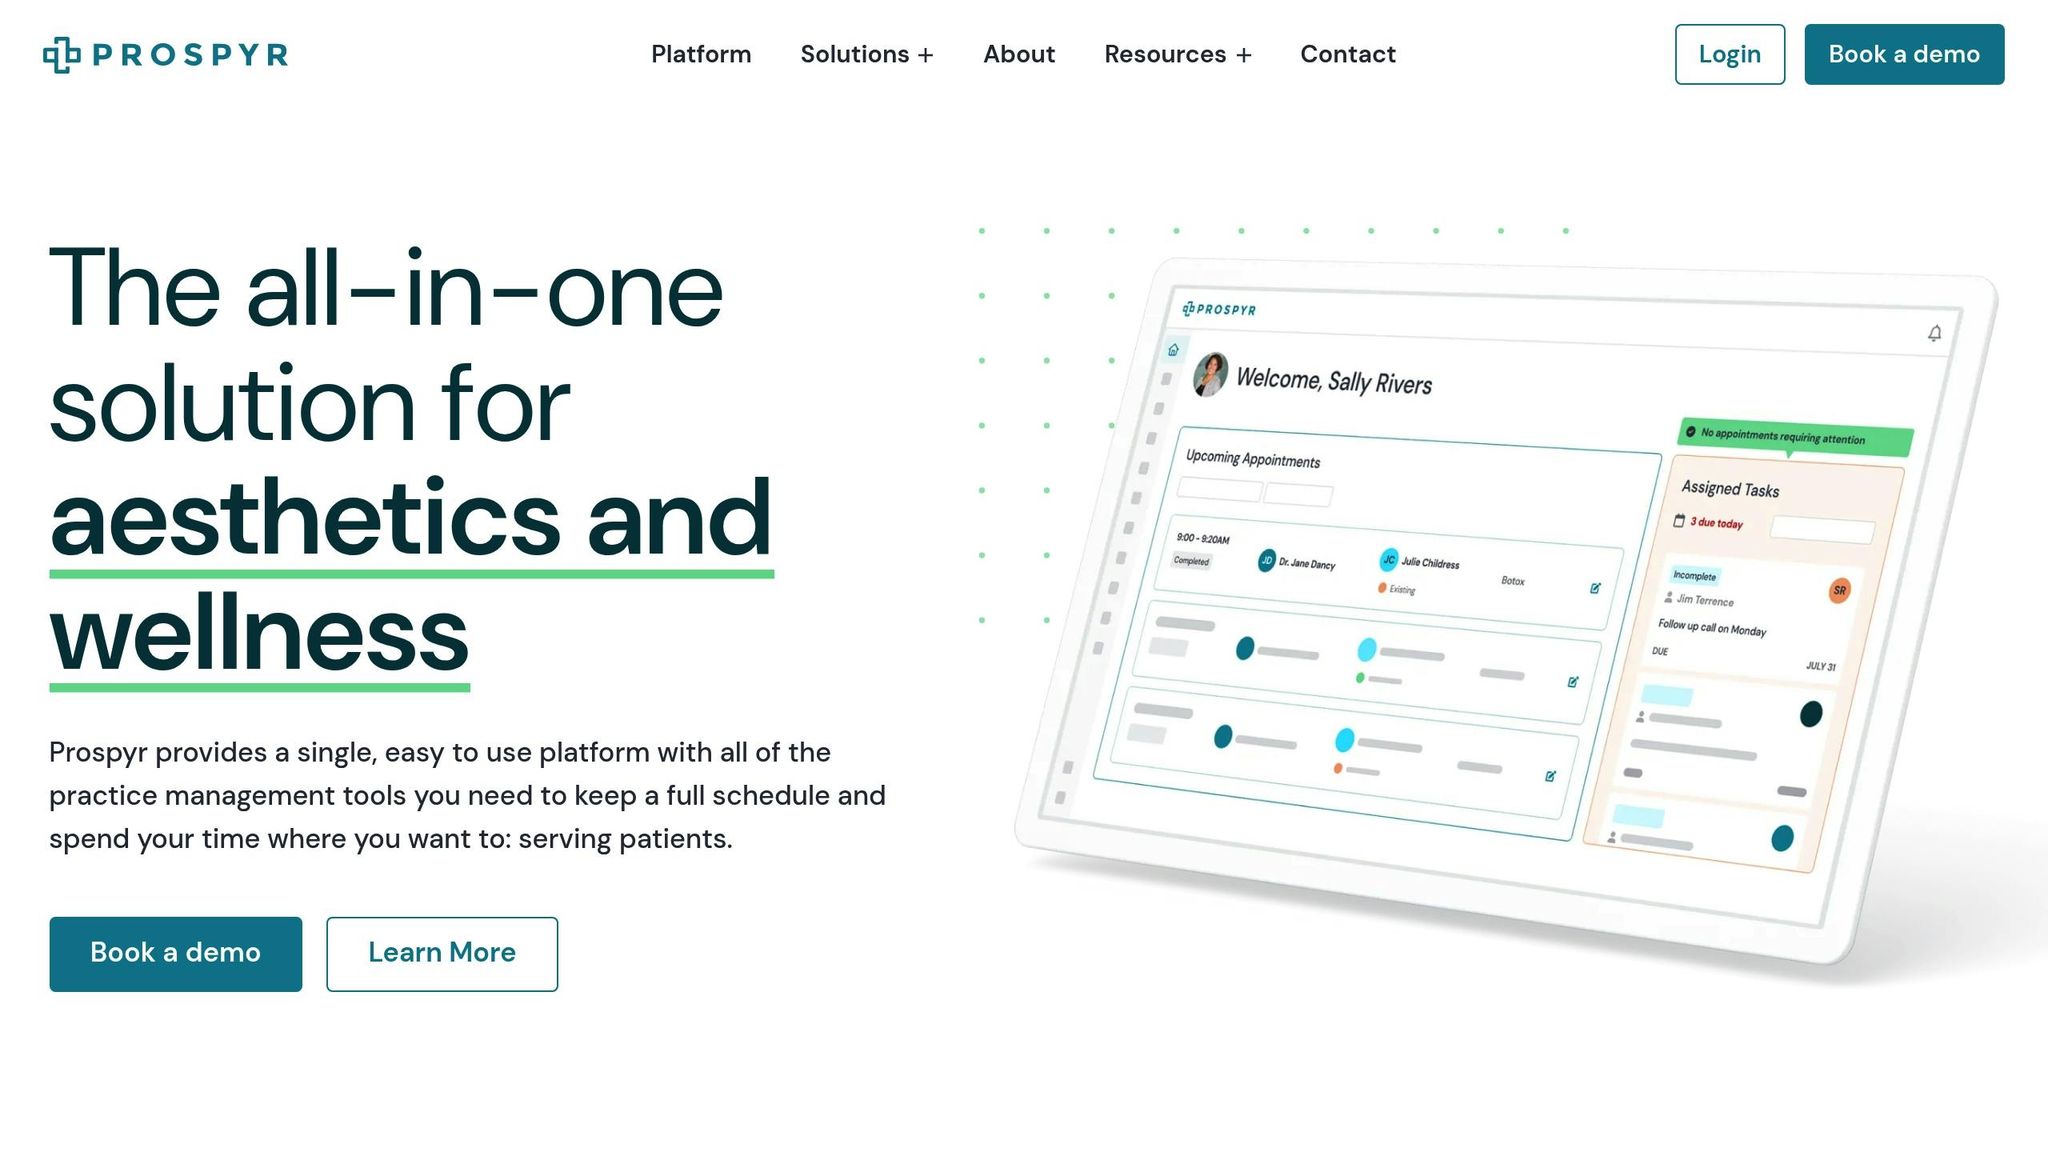
Prospyr provides a comprehensive solution for tracking trends and optimizing operations. By combining essential tools into one HIPAA-compliant platform, it simplifies how practices manage patient data. With integrated CRM/EMR, practice analytics, and AI-powered automation, Prospyr captures, organizes, and analyzes patient data in real time.
Prospyr's Key Features for Tracking Trends
Prospyr's CRM and EMR work together to consolidate patient data from multiple sources, creating a unified system. Digital intake forms streamline data collection, saving time and ensuring accuracy - both critical for effective trend analysis.
The platform’s real-time analytics dashboards pull together financial, operational, and marketing data. This allows practices to identify top-performing treatments, resolve service bottlenecks, and evaluate marketing success. Its Smart Note system speeds up charting by 80%, freeing up valuable time for strategic planning instead of documentation tasks. Additionally, automated lead capture from websites and social media directly feeds into the CRM, providing instant insights into marketing performance and conversion trends.
"We've seen a 50% increase in revenue and a 40% increase in appointments booked since switching away from using several different point solutions to running our practice on Prospyr." – Dr. Daniel Lee, Founder of New Life Cosmetic Surgery
These features not only enhance analytics but also integrate seamlessly into daily operations, boosting efficiency across the board.
Streamline Operations with Prospyr
Beyond analytics, Prospyr takes practice efficiency to the next level with automation tools that simplify scheduling, marketing, and communication. Automated email and SMS campaigns, membership management with auto-renewals, and task management reduce manual work while ensuring consistent data collection.
SOM Aesthetics leveraged Prospyr to launch their practice, generating $40,000 in revenue within the first two days and surpassing $100,000 in monthly revenue within two months.
"Prospyr has helped us launch SOM Aesthetics like a rocketship. Their powerful platform and helpful support have enabled us to exceed our financial targets while delivering an unmatched experience for our patients." – Dr. Saami Khalifian, Founder and CEO of SOM Aesthetics
Conclusion
Data-driven trend tracking is transforming how practices operate and stay competitive. It starts with centralizing patient data using integrated CRM/EMR systems, then monitoring interconnected metrics like patient retention and schedule utilization. This approach helps practices spot market shifts and use predictive analytics to forecast demand up to 90 days in advance.
These insights aren't just numbers - they're tools for making smarter decisions. Metrics like these show where to allocate resources and which services deserve more marketing attention.
"Offering great treatments isn't enough. In today's competitive MedSpa market, the real edge comes from making faster, sharper decisions - the kind backed by data, not hunches." – CorralData
Relying on manual spreadsheets and outdated reports just doesn’t cut it anymore, especially in a market valued at $20.44 billion. Traditional tools can't keep up with real-time analytics, which allow practices to adapt before revenue takes a hit. Real-time insights pave the way for streamlined operations and smarter data management.
Prospyr simplifies this process by combining these capabilities into a single HIPAA-compliant platform. With automated reporting, AI-powered forecasting, and integrated patient management, practices can focus on delivering excellent care while the platform handles the analytics that fuel strategic growth.
FAQs
What data should I centralize first to track treatment trends?
To keep tabs on treatment trends, the first step is to bring all your data together. This includes metrics like treatment popularity, rebooking rates, and patient loyalty. By centralizing this information, you can easily spot patterns and shifts in demand.
It’s also helpful to dig into seasonal trends and treatment types to understand how preferences change over time. Adding details like patient visit data, provider performance, and revenue per treatment hour gives you a well-rounded picture. With this comprehensive approach, clinics can fine-tune their offerings, improve care quality, and make smarter decisions based on real insights.
Which 5–10 dashboard metrics matter most for a medspa?
To run a successful medspa, keeping an eye on the right metrics is essential. These numbers reveal how well your business is operating and how satisfied your clients are. Here are some of the most important ones to track:
- Client Retention Rate: A healthy range is between 60% and 70%. This shows how many clients return after their first visit.
- New Client Acquisition Rate: Ideally, this should fall between 55% and 75%, reflecting how effectively you're attracting fresh clients.
- Utilization Rate: Aiming for 90% to 95% ensures your resources, like staff and equipment, are being used efficiently.
- No-Show Rate: Keeping this between 5% and 8% minimizes lost revenue from missed appointments.
- Average Treatment Revenue per Client: This typically ranges from $500 to $2,000, highlighting the revenue generated per individual.
- Net Promoter Score (NPS): A score above +50 indicates strong client satisfaction and loyalty.
By regularly monitoring these metrics, you can fine-tune your operations, improve client experiences, and boost overall profitability.
How can I forecast demand 30–90 days ahead without bad data?
To predict demand 30–90 days ahead without depending on unreliable data, turn to AI-driven models tailored for situations with limited or messy data. Prioritize data hygiene and use tools capable of managing incomplete or noisy datasets, which can drastically cut down errors. Make sure to include elements like seasonality, demographics, and trends in your predictive models, and connect these seamlessly with your current systems. This strategy delivers precise, practical forecasts, even when the data isn’t flawless.