Best KPIs for Lead Source Tracking
Judge lead sources by six KPIs—CPL, cost-per-consult, booking & no-show rates, close rate, and patient value—to allocate budget wisely.
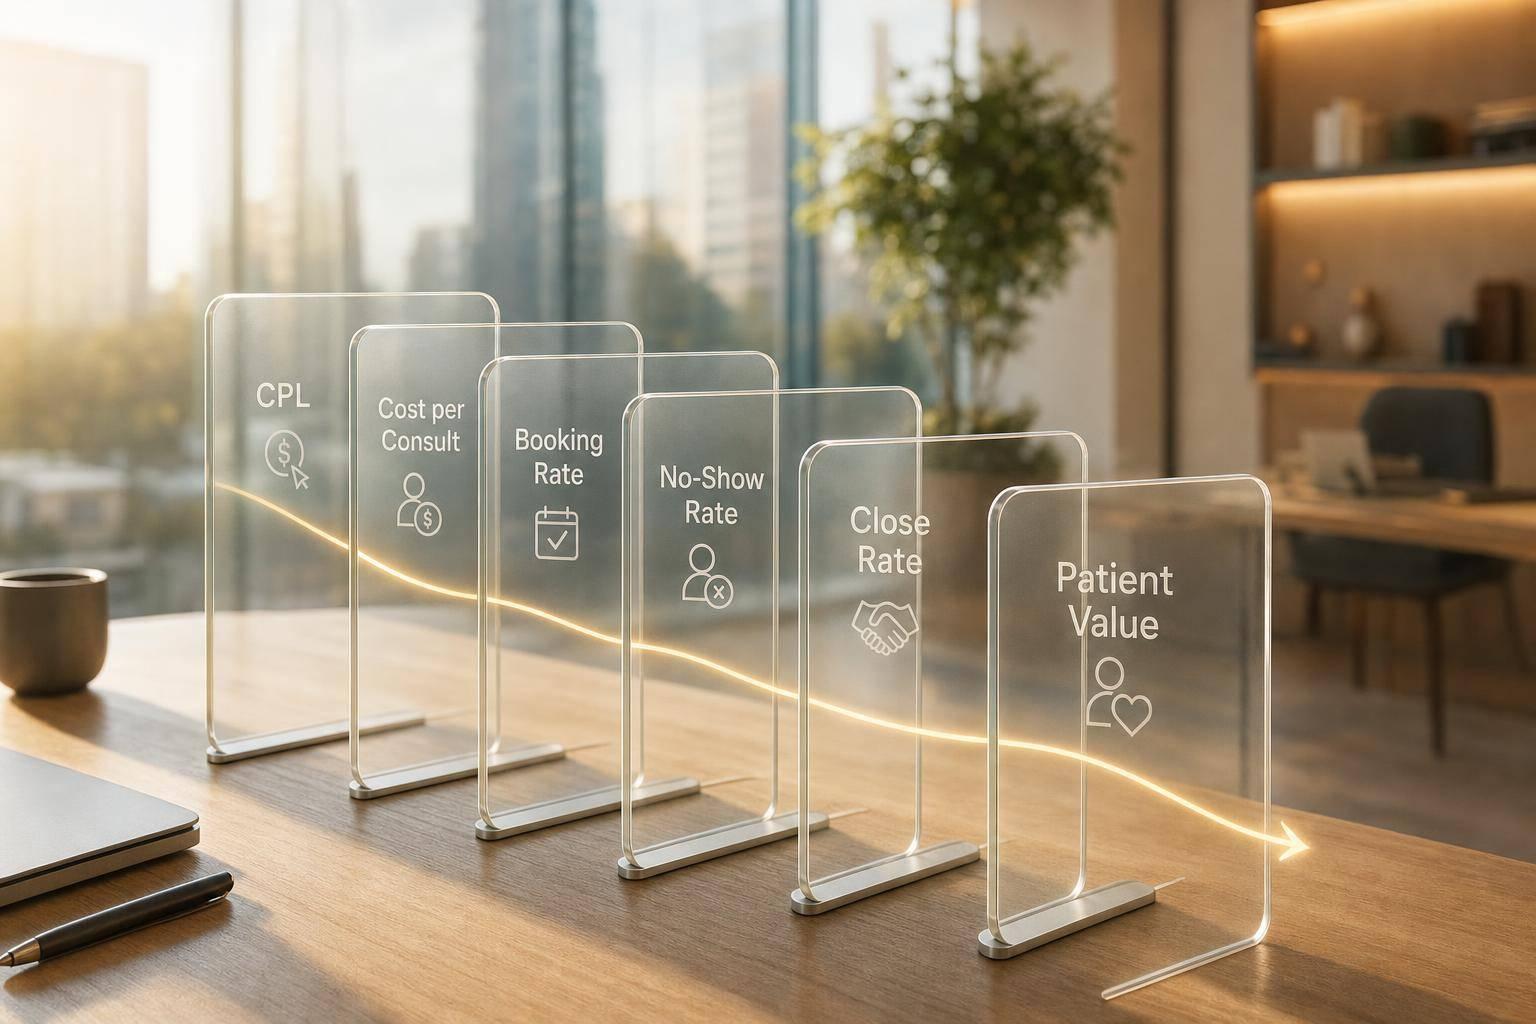

If you track only leads, you can cut spend in the wrong place. I’d watch six KPIs by source: cost per lead, cost per consult, booking rate, no-show rate, close rate, and patient value/payback period.
Here’s the short version: a low CPL can still hide weak lead quality, a high booking rate can still fall apart with no-shows, and a source that closes fewer patients can still win if those patients spend more over time. That’s why I’d tie each source to the full path: inquiry → booked consult → attended consult → treatment start → revenue.
A few numbers make the point fast:
- 62% of practices do not track call sources the right way
- 60% of practice conversions happen by phone
- Leads answered in the first minute convert 3.9x better
- Organic leads book at 18.9% vs. 10.7% for paid ads
- Only about 1 in 9 inquiries becomes a patient
If I had to match each KPI to one job, I’d use:
- Cost per lead: compare channel efficiency
- Cost per consult: see what it costs to get booked demand
- Booking rate: check lead quality and front-desk follow-up
- No-show rate: spot wasted chair time
- Close rate: track consult-to-treatment results
- Patient value / payback period: decide where the next $1 should go
Quick comparison
| KPI | What it tells me | Best use |
|---|---|---|
| Cost per lead | Cost to get an inquiry | Compare source efficiency |
| Cost per consult | Cost to get a booked consult | Judge booking output |
| Booking rate | % of leads that book | Check lead quality |
| No-show rate | % of booked consults that do not attend | Find schedule waste |
| Close rate | % of attended consults that buy | Measure sales result |
| Patient value / Payback period | Revenue and time to earn spend back | Set budget by source |
Bottom line: I would not judge a lead source by one number. I’d read these KPIs together so I can see which channels bring leads, which ones fill the schedule, and which ones bring in patients who produce more revenue.
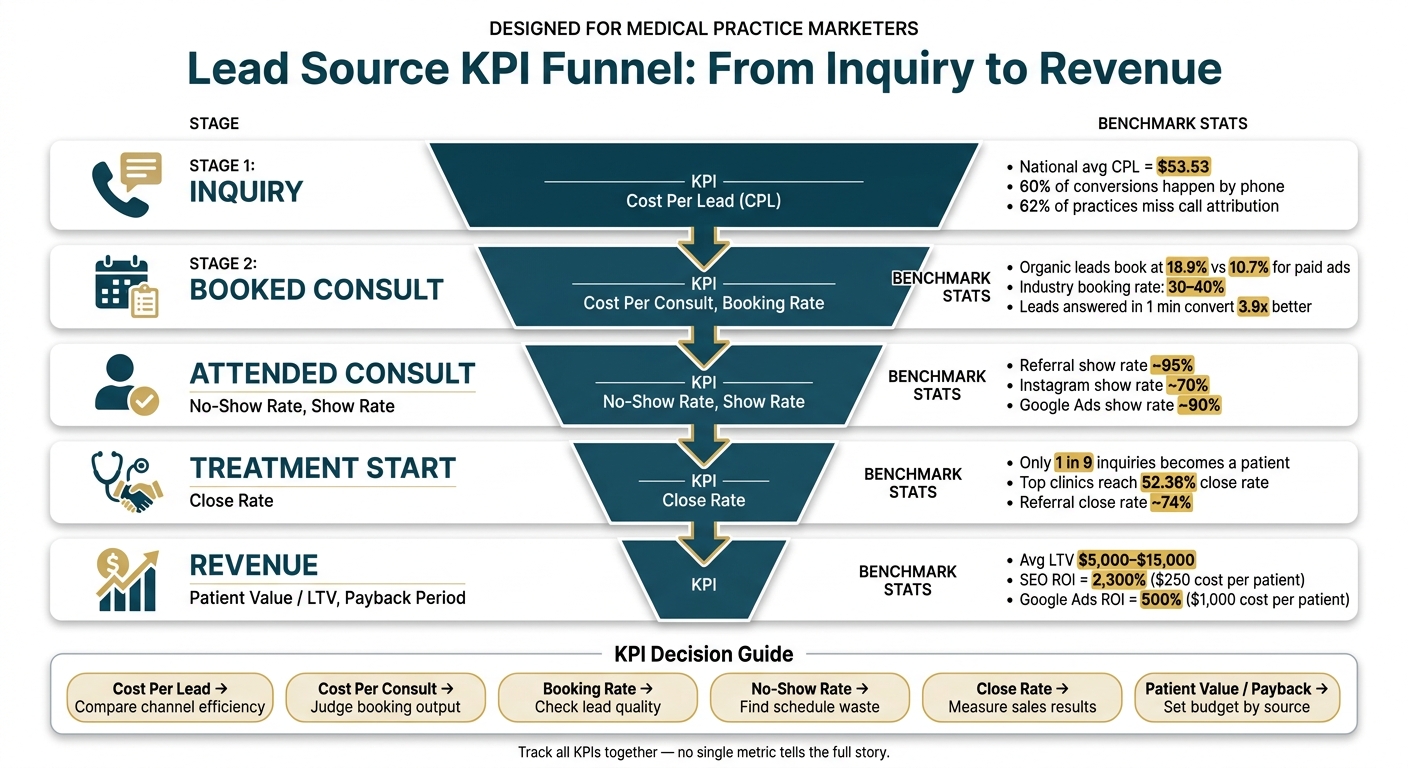
Lead Source KPI Funnel: From Inquiry to Revenue
Top-of-funnel KPIs: Cost per lead, cost per consult, and booking rate
Use CPL, cost per consult, and booking rate together to tell the difference between cheap leads and actual appointment demand.
Cost per lead by source
Cost per lead (CPL) is simple: divide total channel spend by the number of leads it produced. If you spent $5,000 on Google Ads and got 200 leads, your CPL is $25.00. The national average CPL for medical practices is $53.53, so comparing each source against that benchmark can help you spot campaigns that are draining budget.
CPL is useful because it shows which channels bring in leads at a lower cost. But it doesn't tell you whether those leads book. And that's where people get tripped up. A low CPL can look great on paper while the leads go nowhere.
| Lead source | Monthly spend ($) | Leads | CPL ($) | Trend vs. prior month |
|---|---|---|---|---|
| Google Ads | $5,000 | 200 | $25.00 | Down 5% |
| Facebook Ads | $3,000 | 35 | $85.71 | Up 10% |
| SEO (Organic) | $3,000 | 56 | $53.57 | Stable |
There's also a big blind spot here: phone calls. Without call tracking, CPL can miss phone leads and skew source data. Since 60% of practice conversions happen by phone, that gap matters. A practice managed by Think Basis saw Google Ads show up at $300 CPL, but after call tracking was added, the real number dropped to $90. Without that extra data, they might have shut off a campaign that was making money.
So CPL tells you who gets attention. The next step is figuring out who gets people to book.
Cost per consult and booking rate by source
Once you know which channels drive leads, cost per consult and booking rate show which ones turn those leads into appointments.
Cost per consult is your channel spend divided by the number of booked consultations. Booking rate is booked consults divided by total leads.
Organic search leads convert to booked consults at 18.9%, compared with 10.7% for paid ads. That shift changes the math fast:
| Source | Leads | Booked consults | Booking rate (%) | Cost per consult ($) |
|---|---|---|---|---|
| Google Ads | 40 | 15 | 37.5% | $533.33 |
| SEO (Organic) | 30 | 18 | 60.0% | $166.67 |
| Facebook Ads | 50 | 5 | 10.0% | $500.00 |
In this example, Google Ads has the lowest CPL, but SEO produces the lowest cost per consult. That's the catch: CPL can hide low-intent leads. Booking rate and cost per consult show which sources actually book.
Booking rate also gives you a read on what happens after the lead comes in. Industry benchmarks put the typical call-to-booking rate between 30% and 40%. If one source keeps landing below that range, the problem may not be the channel itself. It could be slow follow-up, missed calls, or front-desk friction.
And speed matters more than most teams think. Leads answered within the first minute convert 3.9x better, which means response time is part of top-of-funnel performance too.
Next, use no-show rate and close rate to see which booked consults actually become revenue.
Reading about the problem? See how Prospyr solves it in one platform.
Book a DemoMid-funnel KPIs: No-show rate and close rate
A source can look great at the top of the funnel and still fall apart after the appointment gets booked. That’s where no-show rate and close rate come in. If CPL and booking rate tell you there’s demand, these two KPIs tell you whether that demand actually turns into action.
In plain English: they show whether a source turns booked interest into attended consults and then into paid treatment.
No-show rate and show rate by source
No-show rate measures the share of scheduled consultations where the prospect didn’t show up. Show rate is the flip side. Together, they show which sources are wasting clinical capacity. In practice, that means sources with high no-show rates can leave providers sitting on unused time.
| Source | Consults Booked | No-Shows | No-Show Rate (%) | Show Rate (%) |
|---|---|---|---|---|
| Google Ads | 50 | 5 | 10% | 90% |
| 40 | 12 | 30% | 70% | |
| Referral | 20 | 1 | 5% | 95% |
The pattern here is pretty clear. Referral traffic shows up at a much higher rate than Instagram, even though Instagram booked more consults. That matters because booked appointments don’t help much if the patient never walks through the door.
Automated 2-way SMS reminders and follow-up messages after booking can help improve show rates.
Close rate from consult to paid treatment
Close rate measures how many attended consultations turn into a paid treatment. Some clinics also track new patients divided by leads as a full-funnel close rate.
This KPI helps you see which sources bring in patients who are ready to move forward. Industry data shows that only 1 in 9 medical practice inquiries converts into a patient. At the high end, top-performing clinics reach a close rate of about 52.36%.
| Source | Leads | Booked Consults | Attended Consults | New Patients | Close Rate (%) |
|---|---|---|---|---|---|
| Google Ads | 200 | 50 | 45 | 15 | 33% |
| 300 | 40 | 28 | 7 | 25% | |
| Referral | 30 | 20 | 19 | 14 | 74% |
A source can book a lot of consults and still lag when it’s time to close. Google Ads produces more new patients than Instagram, even with fewer leads. Referral stands out even more, with 14 new patients from 19 attended consults and a 74% close rate.
To keep these KPIs clean, clinics should connect lead source data inside an integrated CRM and EMR, so the original source stays tied to appointment status and the final financial transaction. If a source books well but closes poorly, patient value and payback period help answer the next question: is it still worth funding?
Revenue KPIs: Patient value and payback period
Once a source converts, the next step is simple: what is that patient worth, and how fast do you earn your money back?
Patient value and LTV by source
Patient value is the average revenue a patient brings in from a given source over a set period. Lifetime value (LTV) looks at the full patient relationship.
To calculate source-level LTV, divide total revenue from that source over three years by the number of patients acquired. If you need a fast estimate, use:
average revenue per visit × visits per year × retention years
Average patient value often tops $8,000 over the full relationship, and LTV usually falls between $5,000 and $15,000, based on procedure mix and retention. A referred patient who comes back for several treatments each year is worth much more than a paid-ad patient who visits once and never returns.
| Source | Avg. First-Visit Revenue ($) | Avg. Annual Revenue ($) | Estimated LTV (3-Year) ($) |
|---|---|---|---|
| SEO / Organic Search | High intent | $2,000–$5,000 | $5,000–$15,000 |
| Paid Ads (PPC) | Moderate | $1,500–$3,000 | $4,500–$9,000 |
| Patient Referrals | Very high | $3,000–$6,000 | $9,000–$18,000 |
Higher retention can push source-level LTV up fast, especially with patients who come in for repeat treatments.
Patient value tells you the long game. Payback period tells you how fast the cash comes back.
Payback period and ROI by source
Payback period answers a direct cash flow question: how long does it take for a source to pay back what you spent on it?
The formula is straightforward:
marketing spend ÷ monthly gross profit from that source
Use ROI to track return. Use payback period to track speed.
SEO produced a 2,300% ROI with a $250 cost per patient, while Google Ads produced 500% ROI with a $1,000 cost per patient.
| Source | Marketing Spend ($) | Attributed Revenue ($) | Gross Profit ($) | ROI (%) | Payback Period (Months) |
|---|---|---|---|---|---|
| Google Ads | $8,000 | $48,000 | $40,000 | 500% | ~2.0 |
| SEO | $3,000 | $72,000 | $69,000 | 2,300% | ~0.5 |
| Social Media | $5,000 | $18,000 | $13,000 | 260% | ~3.3 |
A shorter payback period means cash returns faster. That matters when you're deciding where to put more budget, because you don't have to wait through long revenue cycles to see if the spend was worth it.
Putting the KPIs into one dashboard
Once the KPIs are set, the next move is simple: put them into one source-level dashboard.
Data the clinic must capture consistently
Start by tagging the source at first contact. That attribution needs to go into the patient record right away. This matters more than many teams think. About 62% of healthcare practices fail to handle call attribution the right way, which means their CPL and ROI figures are based on partial data.
From there, the clinic should track consult status and revenue tied straight to each patient record. Then review source performance every week or month.
When those fields are logged the same way each time, the clinic can see each KPI by source in one place.
How Prospyr can centralize source-level KPI reporting
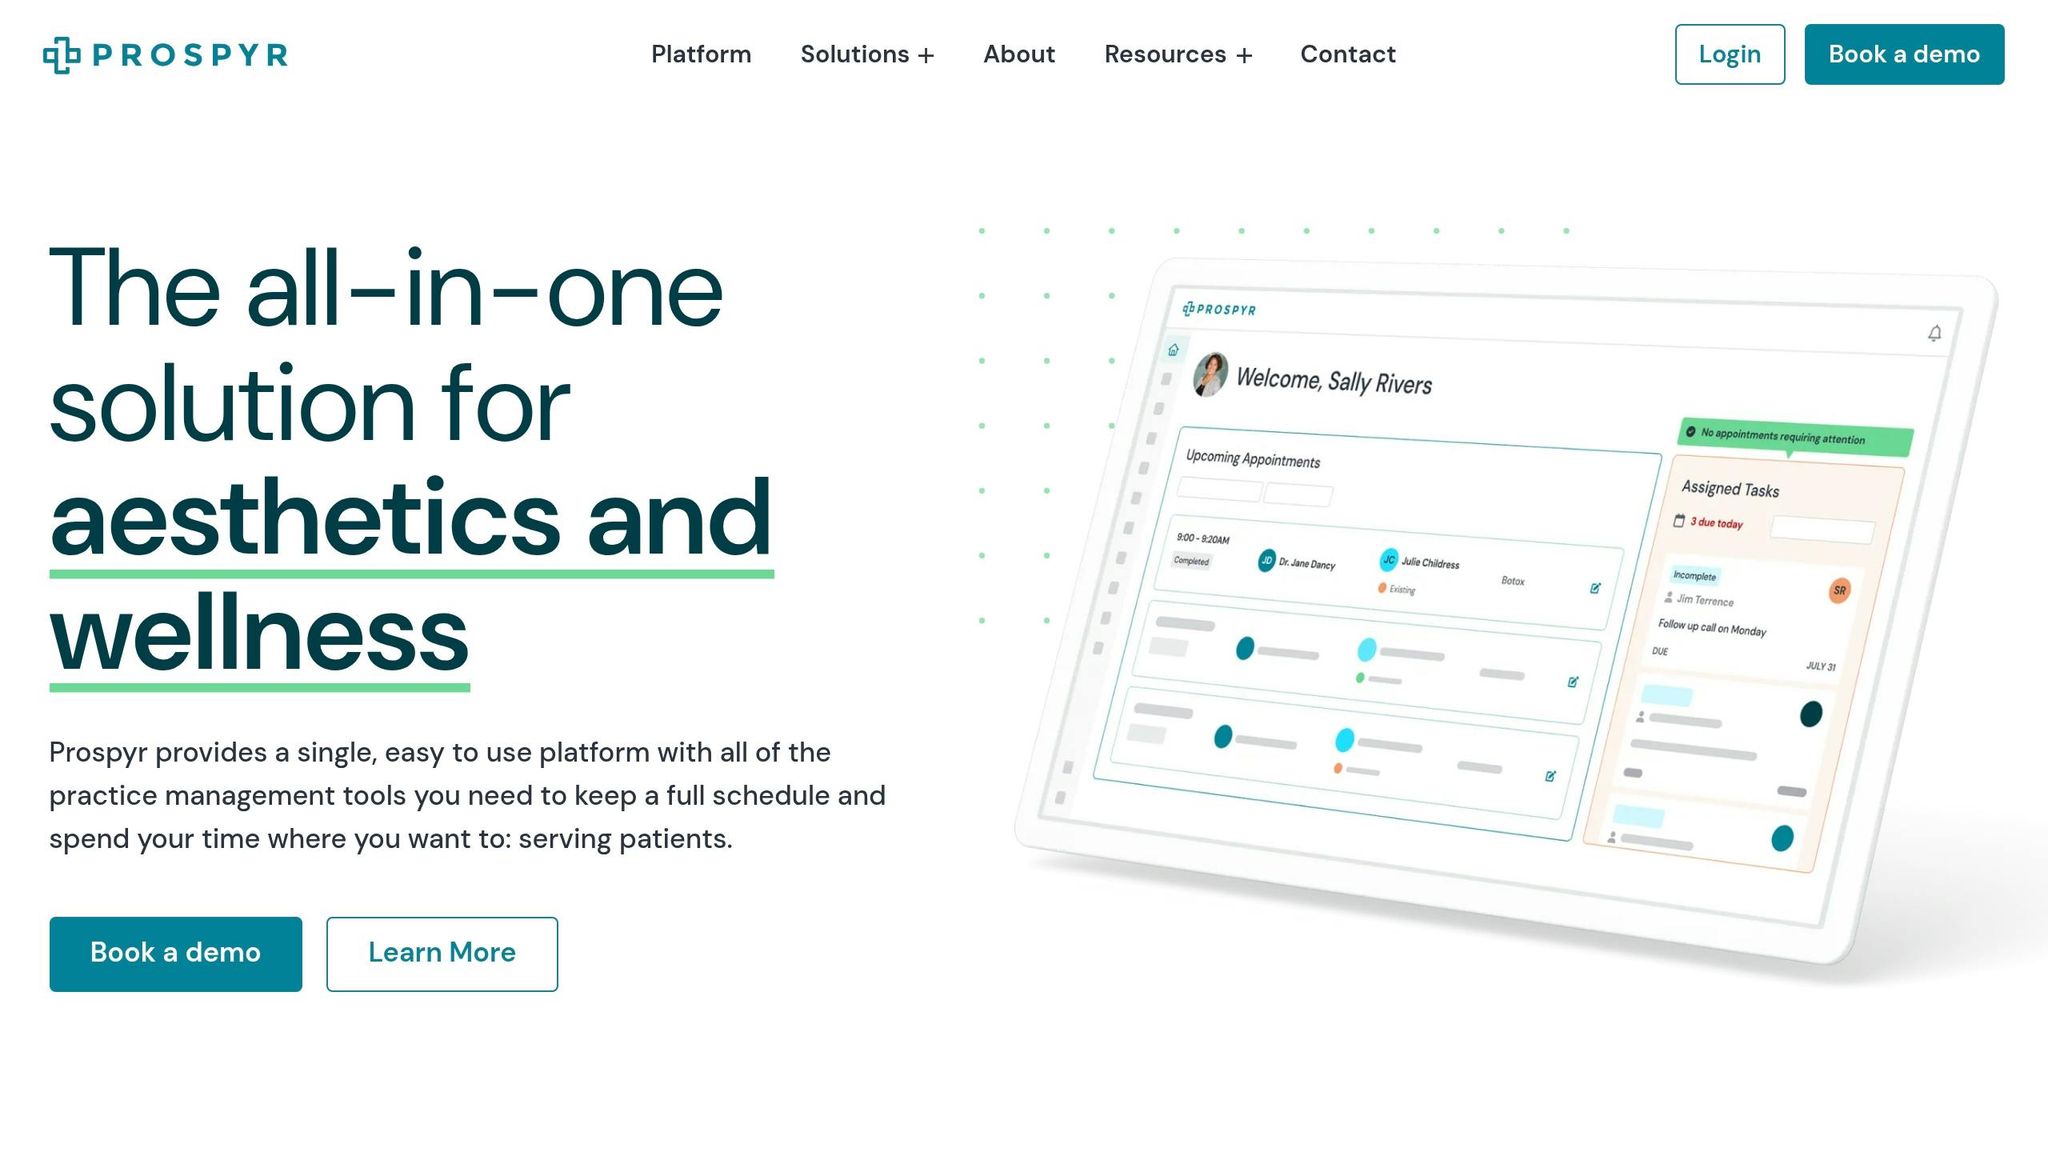
A platform like Prospyr can bring source attribution, scheduling, digital intake, payments, and analytics into one HIPAA-compliant CRM/EMR. Its real-time analytics track CPL, booking rate, no-show rate, close rate, patient value, and payback period by source.
That setup gives teams one dashboard instead of a mess of spreadsheets, call logs, and billing data. And when all the numbers sit together, the team can move fast.
Conclusion: Which KPI to use for each decision
Each KPI answers a different question.
- Use cost per lead to compare acquisition efficiency across channels.
- Use cost per consult and booking rate to judge lead quality. A cheap lead that never books still burns budget.
- Use no-show rate to spot scheduling reliability problems by source.
- Use close rate to measure how well consults turn into paid treatments.
- Use patient value and LTV to estimate long-term revenue potential.
- Use payback period when deciding where to scale budget.
| KPI | Use for |
|---|---|
| Cost per lead | Comparing acquisition efficiency across channels |
| Cost per consult / Booking rate | Evaluating lead quality |
| No-show rate | Identifying scheduling reliability issues by source |
| Close rate | Measuring consult-to-treatment conversion |
| Patient value / LTV | Projecting long-term revenue by source |
| Payback period | Making scaling and budget allocation decisions |
No single KPI gives the whole picture. But when you review them together - and tie each one back to the original source - you can see what’s working, what’s draining budget, and where the next $1 should go.
FAQs
Which KPI should I prioritize first?
Start with marketing campaign ROI. It tells you how well your spend turns into collected revenue, so you can see which channels bring in profit and which ones just drive volume.
After that, look at your missed call rate. For many practices, it’s the biggest leak in the acquisition funnel. Prospyr’s unified practice analytics helps you track both in one place.
How often should I review lead source KPIs?
Review your lead source KPIs monthly. A 30-day check-in gives you enough data to spot patterns, see what’s paying off, and try changes to your marketing or scheduling approach without flying blind.
Prospyr’s analytics dashboards help with this by giving you real-time visibility into KPIs like conversion rates and lead-to-appointment metrics. That makes it easier to find bottlenecks and adjust your strategy.
What tools help track lead sources accurately?
Accurate lead source tracking works best when your marketing and patient data live in one place. Prospyr pulls in interest from your website, landing pages, and social media, then tracks leads and reviews costs so you can see which marketing efforts drive the best results.
For a broader view of search and local traffic, use Google Analytics 4, Google Search Console, and UTM parameters. These tools help you track how each campaign is performing.